
When you step into the world of trading, you'll encounter various charting methods, with Heikin Ashi and traditional candlestick patterns being among the most popular. Although they might seem similar at first glance, they serve much different purposes and offer unique insights into market behavior.
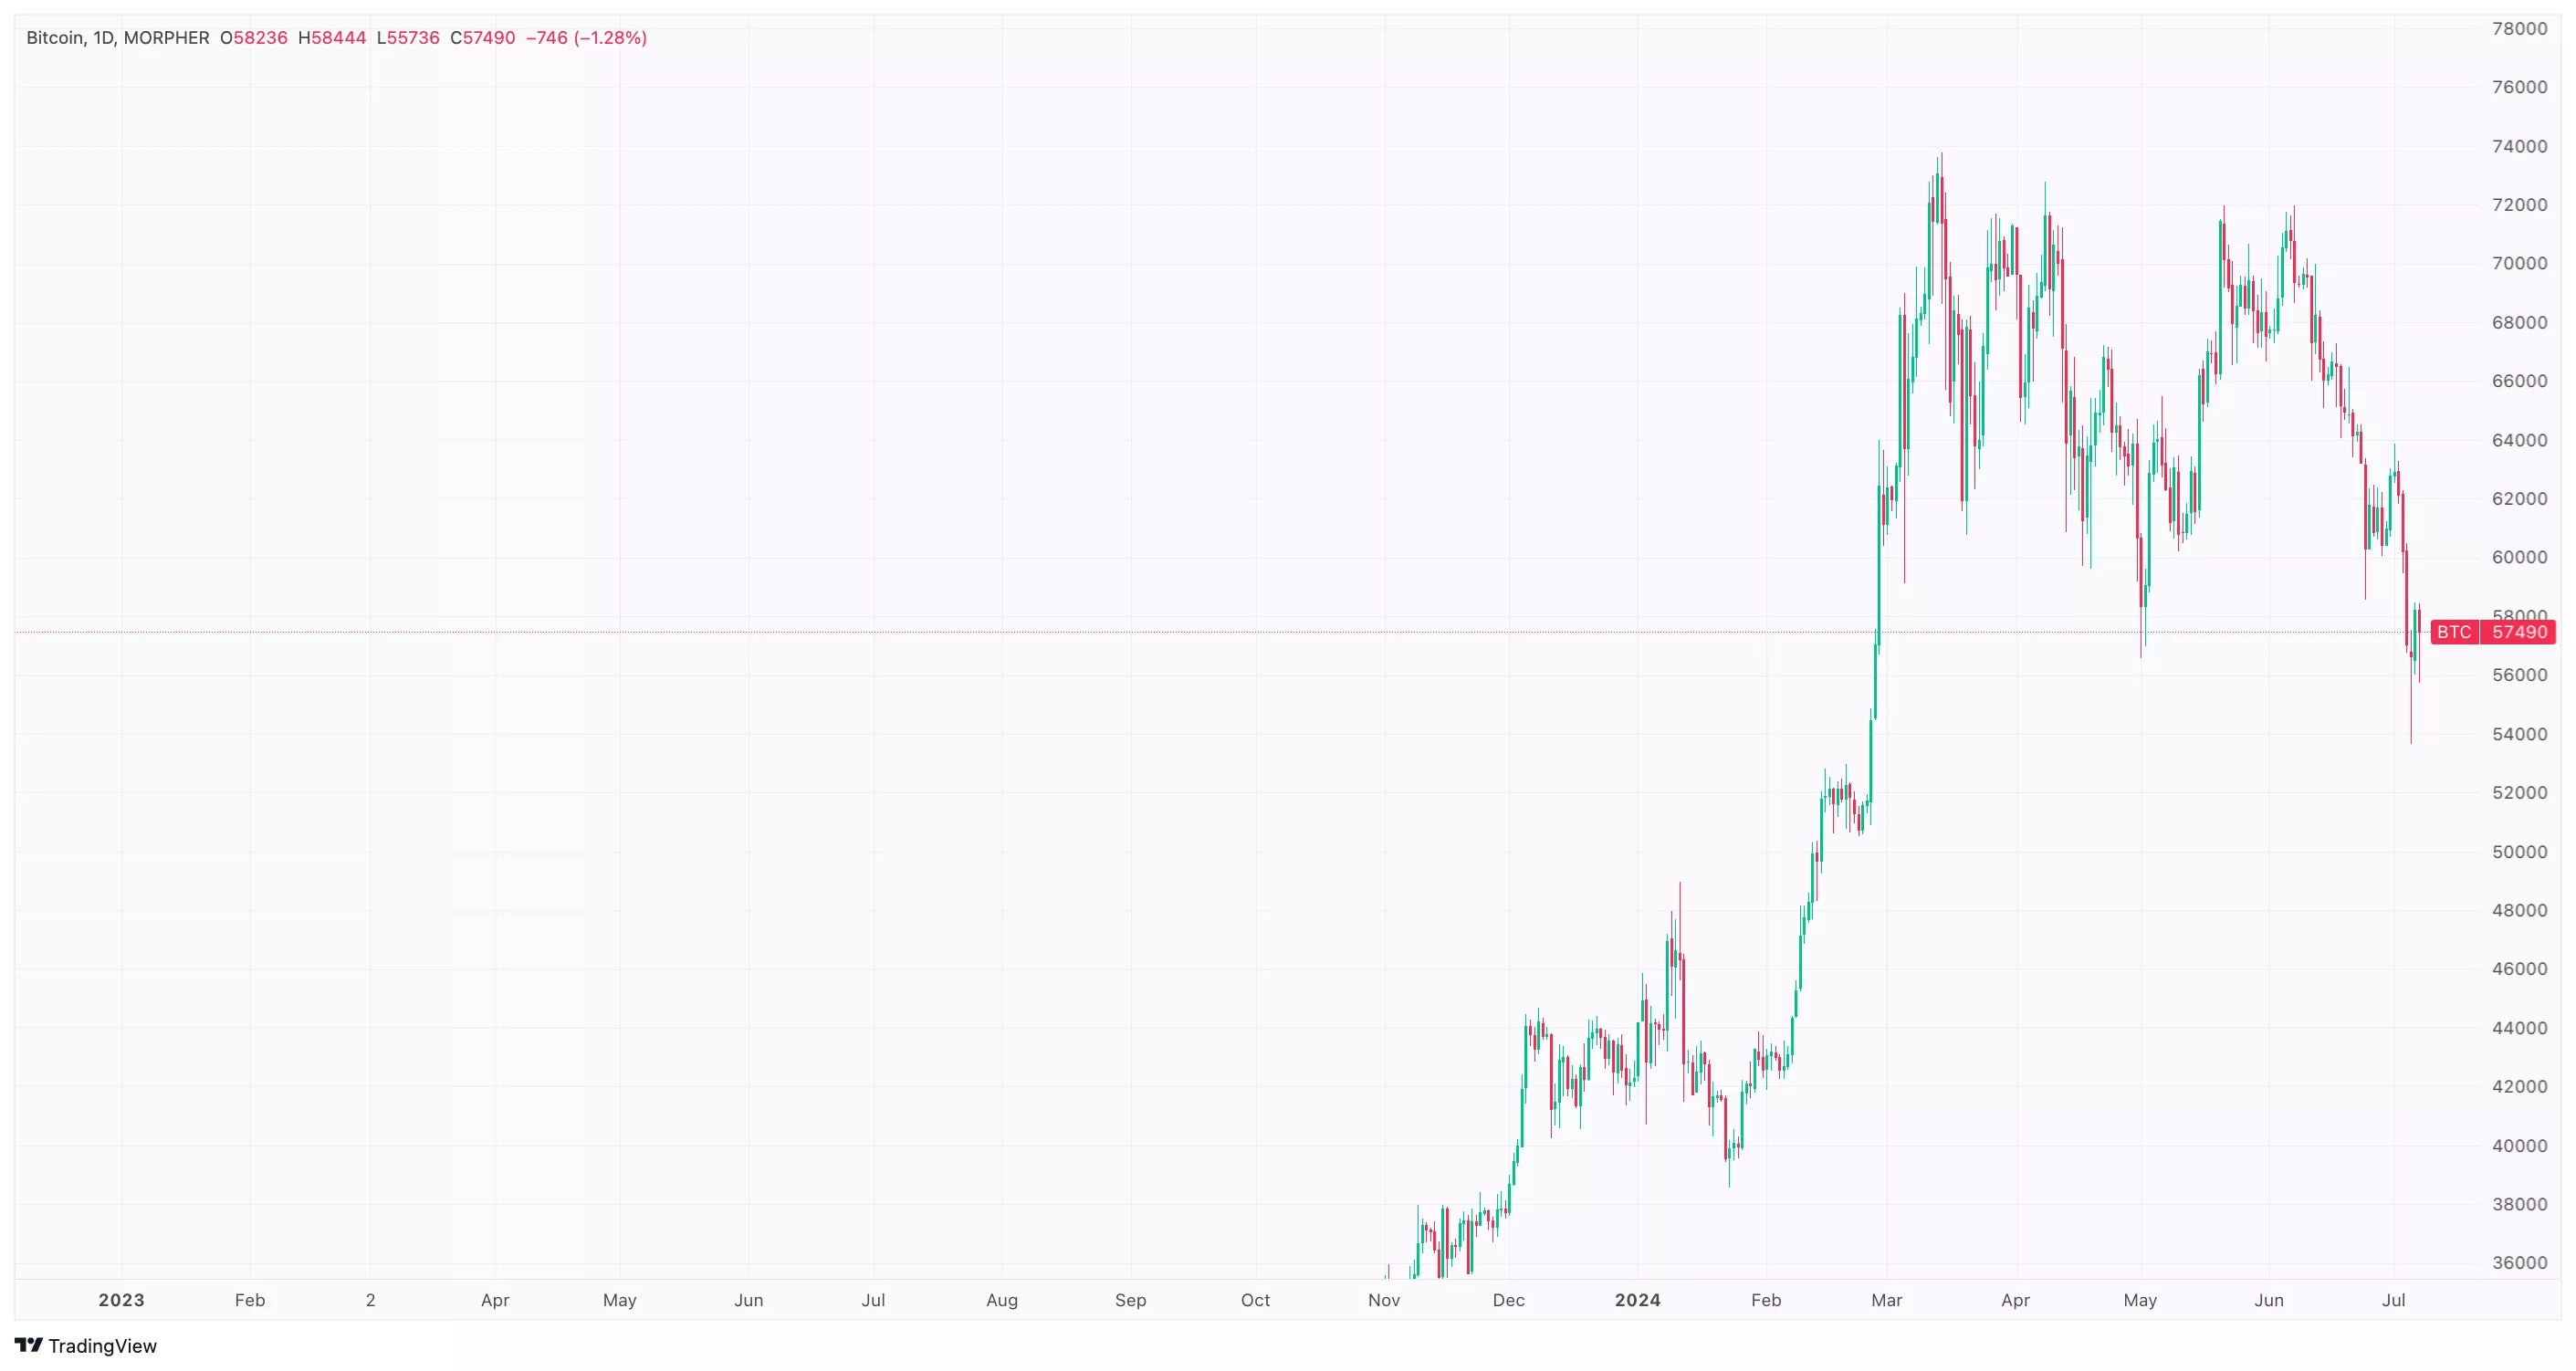
Candlestick patterns are the foundation of technical analysis. They provide a visual representation of price movements within a specific time frame, capturing the opening, closing, highest, and lowest prices. Each candlestick tells a story: a green candlestick indicates that the closing price was higher than the opening price, suggesting bullish behavior. Conversely, a red candlestick shows that the closing price was lower than the opening, indicating bearish sentiment. Traders have relied on these patterns for centuries to gauge market sentiment and predict potential price movements.
(Click on image to enlarge)
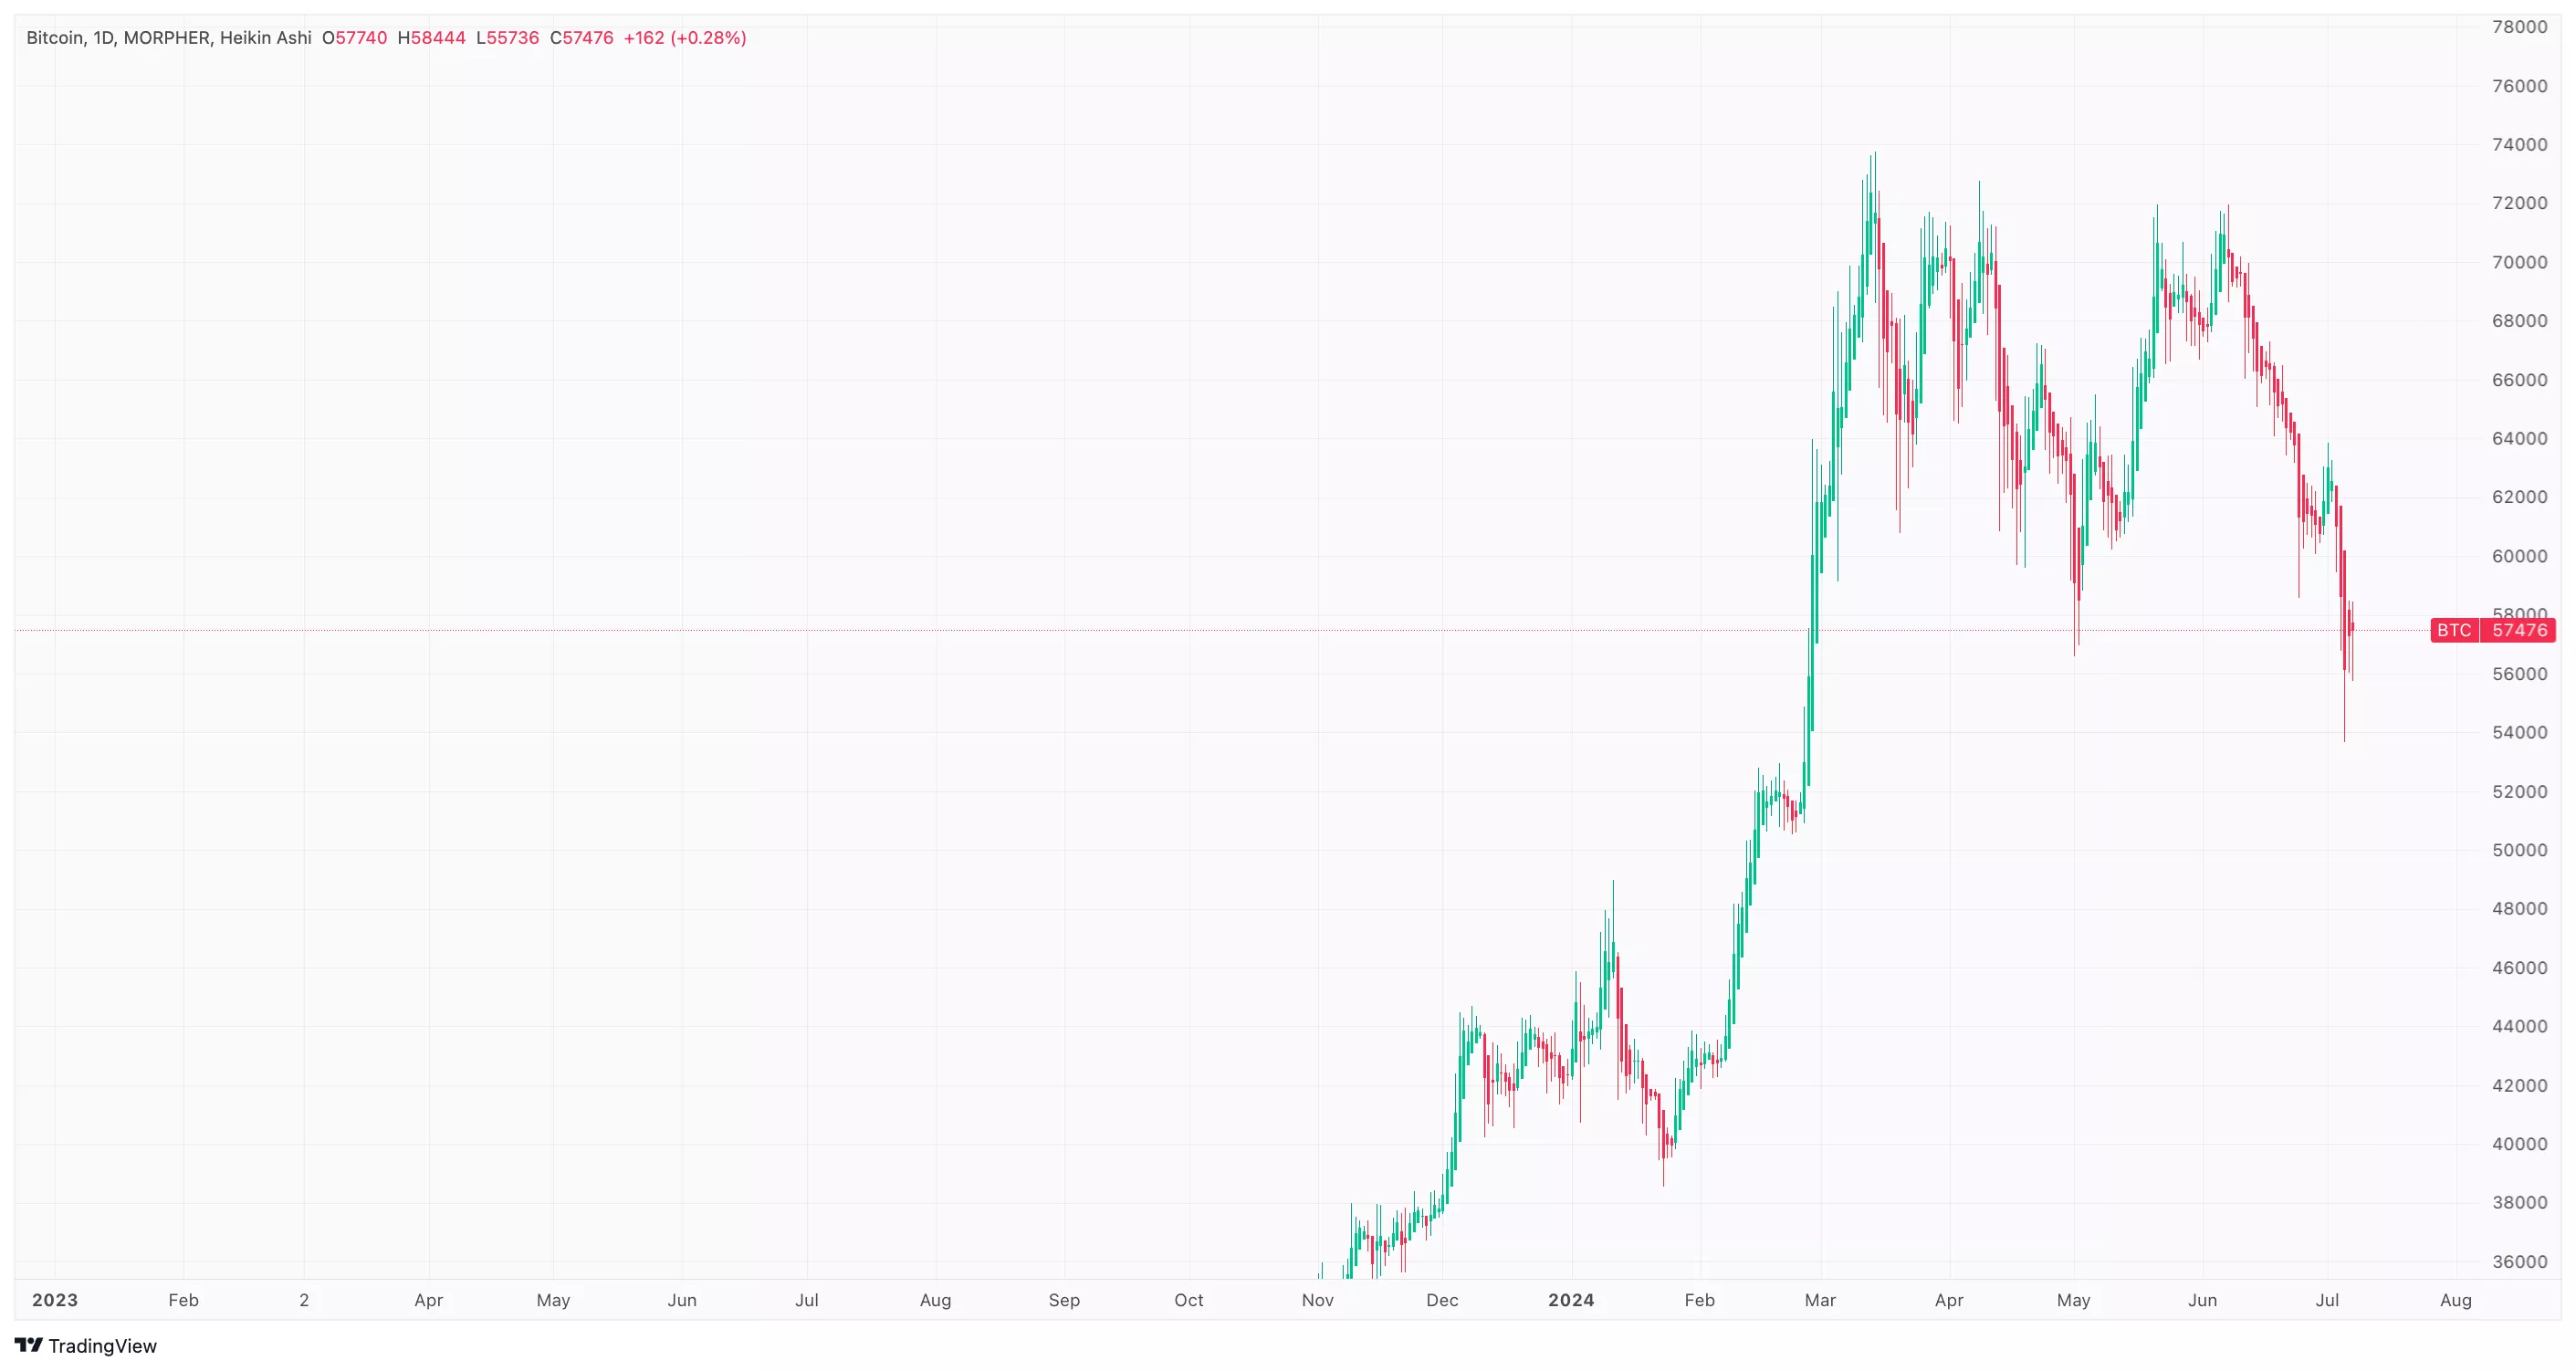
On the other hand, Heikin Ashi charts offer a different approach by smoothing out price data to create a clearer picture of market trends. The term "Heikin Ashi" means "average bar" in Japanese, and it lives up to its name by averaging out prices over a specified period. This method reduces the noise seen in traditional candlestick charts, making it easier to spot ongoing trends. For instance, a series of consecutive green bars in a Heikin Ashi chart suggests a strong uptrend, while a string of red bars indicates a downtrend.
(Click on image to enlarge)
The main difference between the two lies in their construction. Traditional candlestick patterns reflect actual price movements, capturing the immediate sentiment of the market. This can be particularly useful for short-term traders who need to make quick decisions based on rapid price changes. Heikin Ashi, however, uses averaged data, which smooths out these fluctuations. This makes it an excellent tool for long-term traders who want to identify and follow broader trends without being distracted by short-term volatility.
To illustrate, imagine you are observing a volatile stock. A traditional candlestick chart might show a confusing mix of red and green candlesticks, reflecting the stock’s erratic behavior. However, when you switch to a Heikin Ashi chart, the trend becomes clearer. You might see a more consistent series of green bars, indicating a steady upward trend, or a prolonged string of red bars, pointing to a downtrend. This clarity can help you make more informed decisions, whether you're buying, selling, or holding a position.
Choosing between Heikin Ashi and traditional candlestick patterns depends on your trading strategy and goals. If you are a short-term trader looking to capitalize on quick market movements, traditional candlestick patterns might be more beneficial. They provide detailed insights into price changes and can help you identify potential entry and exit points quickly. On the other hand, if you prefer a long-term trading approach, Heikin Ashi charts can help you stay focused on the overall trend, reducing the impact of daily price swings.
In conclusion, while Heikin Ashi and traditional candlestick patterns might look similar, they serve different purposes in technical analysis. Understanding these differences can enhance your trading strategy, helping you navigate the markets more effectively. By mastering both charting techniques, you can gain a clearer, more comprehensive view of market trends, whether you're aiming for short-term gains or long-term growth.
More By This Author:
How To Use MACD To Spot Trend Reversals
The Dream Of Perfect Competition In The Stock Market
Spot Market Reversals With The Gaussian Channel Indicator


Comments
Log in or sign up to join the conversation.