

Image Source: Pexels
When you start trading, you see that identifying trend reversals can make a huge difference to your success. One tool that has proven it's reliability to me and many others is the Moving Average Convergence Divergence, or MACD. While the name might sound intimidating, the MACD is actually a straightforward and powerful indicator that can help you navigate the markets more effectively. I will try to explain how to use MACD to spot trend reversals earlier in the market.
At its core, the MACD is a momentum indicator that highlights changes in the strength, direction, momentum, and duration of a trend. It works by comparing two moving averages of a stock's price, typically the 12-period and 26-period Exponential Moving Averages (EMAs). The MACD line, which is the difference between these two EMAs, provides the foundation of the indicator.
Overlaying the MACD line is the Signal line, which is the 9-period EMA of the MACD line itself. When the MACD line crosses above or below the Signal line, it generates signals that can suggest a potential change in trend direction. Traders often look for these crossovers to identify buying or selling opportunities.
For example, when the MACD line crosses above the Signal line, it can indicate that the stock is gaining upward momentum. This is often seen as a bullish signal, suggesting that it might be a good time to buy. Conversely, when the MACD line crosses below the Signal line, it can indicate that the stock is losing momentum, which is typically a bearish signal and might suggest it’s time to sell.
However, crossovers are just one part of the MACD's utility. Another critical aspect is the concept of divergence. Divergence occurs when the direction of the MACD line and the stock's price movement start to diverge. If the price is making new highs, but the MACD line is not, this bearish divergence can indicate that the upward momentum is weakening and a downward reversal might be imminent. On the flip side, if the price is making new lows while the MACD line starts to rise, this bullish divergence might suggest that the downtrend is losing strength and an upward reversal could be on the way.
The zero line, where the MACD and Signal lines are equal, is another important feature. When the MACD line crosses above the zero line, it indicates that the short-term average is higher than the long-term average, signaling positive momentum. When it crosses below, it signals negative momentum. These zero-line crosses can provide further confirmation of trend reversals.
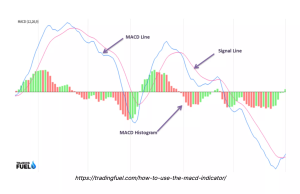
Then there's the histogram, a visual representation of the difference between the MACD line and the Signal line. When the histogram is positive and increasing, it indicates that the MACD line is rising faster than the Signal line, suggesting increasing upward momentum. Conversely, when the histogram is negative and decreasing, it suggests increasing downward momentum.
Using the MACD effectively requires more than just understanding these signals; it also involves integrating it with other tools and indicators. For instance, combining MACD with the Relative Strength Index (RSI) can provide additional confirmation of potential reversals. The RSI measures the speed and change of price movements and can help identify overbought or oversold conditions, which can be particularly useful when used alongside MACD signals.
Moreover, context is crucial. A bullish MACD crossover in a strong downtrend might not be as reliable as one in an uptrend. Similarly, divergences need to be considered within the broader market context and other technical signals.
In practice, traders should also be mindful of the time frames they are analyzing. The MACD can be applied to different time frames, and its signals can vary accordingly. Shorter time frames might provide more signals, but they can also be more prone to noise. Longer time frames can offer more reliable signals, but they might be slower to react to market changes.
In summary, the MACD is a versatile and powerful tool for spotting trend reversals. By understanding its components—crossovers, divergences, zero-line crosses, and the histogram—you can gain valuable insights into market momentum and potential turning points. Remember, though, that no single indicator should be used in isolation. The best trading decisions come from a comprehensive analysis that incorporates multiple tools and perspectives.
Using MACD effectively is as much an art as it is a science. It requires practice, patience, and a willingness to look at the bigger picture. By doing so, you can enhance your ability to navigate the markets and make more informed trading decisions.
More By This Author:
The Dream Of Perfect Competition In The Stock Market
Spot Market Reversals With The Gaussian Channel Indicator
Evening Star Candlestick Pattern Explained


Comments
Log in or sign up to join the conversation.