
As an avid trader, I constantly seek out reliable indicators that can help me navigate the complex world of stock market investments. Among the plethora of tools available, candlestick patterns have proven to be invaluable for my trading strategy. One such pattern that has consistently provided me with actionable insights is the Evening Star. In this article, our author shares a brief overview of the Evening Star pattern, its significance for market predictions, and a real-life example from Tesla (TSLA) stock to illustrate its practical application. - Anes Bukhdir
What is an Evening Star Pattern?
The Evening Star is a bearish reversal candlestick pattern that typically appears at the top of an uptrend, signaling that the upward momentum is losing strength and a downtrend may follow. It consists of three distinct candles:
First Candle: A long bullish (green) candle, which indicates the continuation of the current uptrend.
Second Candle (Doji): A doji candle, which has a very small body and reflects market indecision. This candle gaps up, creating a star-like appearance.
Third Candle: A long bearish (red) candle that closes well into the body of the first candle, confirming the reversal.
On a chart, the Evening Star pattern looks like a bright star at the peak of an upward trend, followed by a significant downturn, much like an evening star signaling the end of day and the onset of night.
Importance for Market Predictions
The Evening Star pattern is particularly significant for market predictions for several reasons:
Reversal Signal: It is a strong indicator that the current uptrend is losing momentum and a downtrend may be imminent. This provides traders with a warning to prepare for potential bearish market movements.
Decision-Making: Identifying this pattern can help traders decide whether to exit long positions or enter short positions, thus optimizing their trading strategies.
Market Sentiment: The pattern reflects a shift in market sentiment from bullish to bearish, indicating that buyers are losing control and sellers are starting to dominate.
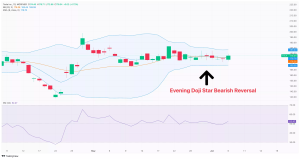
Recently, the TSLA (Tesla, Inc.) stock exhibited an Evening Star pattern, indicating a potential bearish reversal. Let’s delve deeper into the specifics of this example, using the provided chart for reference.
-
First Candle (Bullish): On May 25, 2024, TSLA's stock closed at $183.94, forming a strong bullish candle. This candle marked the continuation of the prevailing uptrend and was characterized by a significant price increase from the previous day’s close.
-
Second Candle (Doji): On May 26, 2024, a doji candle appeared with a closing price of $183.06. This candle opened with a gap up at $183.44 and reached a high of $183.84, but closed near its opening price, indicating market indecision. The doji reflects that neither buyers nor sellers had control, signaling a potential trend reversal.
-
Third Candle (Bearish): On May 27, 2024, a long bearish candle closed at $176.76, well within the body of the first bullish candle. This candle confirmed the bearish reversal, as it represented a significant decline from the doji’s closing price. The bearish sentiment was evident as the price dropped from an intraday high of $183.84 to a low of $169.08 before closing at $176.76.
Analysis of Price Levels:
- Highs and Lows: The first candle had a high of $183.94 and a low of $176.26. The doji’s high was slightly lower at $183.84, and the final bearish candle had a high of $183.44 and a low of $169.08. This progression shows decreasing highs and significant intraday volatility, indicating weakening bullish momentum and increasing bearish pressure.
- Closing Prices: The closing prices of $183.94 (first candle), $183.06 (doji), and $176.76 (third candle) highlight a clear shift in market sentiment from bullish to bearish. The closing price of the third candle being well below the first candle’s close is a strong confirmation of the reversal.
As a trader, I have found the Evening Star candlestick pattern to be a powerful tool for predicting market reversals and understanding market sentiment shifts. Recognizing this pattern can help traders make strategic decisions to protect their investments or capitalize on anticipated market movements. The recent appearance of this pattern in TSLA’s stock chart, with detailed price level analysis, underscores its practical application and significance in technical analysis. By incorporating the Evening Star pattern into your trading strategy, you can enhance your ability to anticipate market trends and make more informed trading decisions.
More By This Author:
The Post ETF Check: What Happens With ETH?
Spotting The CME Gap: A Bitcoin Trader's Weekend Insight
Common Pitfalls In Short-Term Trading And How To Avoid Them


Comments
Log in or sign up to join the conversation.