
Initial Jobless Claims Keeps Killing It
Just when you thought last week’s Initial Jobless Claims couldn’t get much better, this week’s release smashed estimates once again! Seasonally adjusted initial claims came in at the lowest reading since September of 1969 at 192K, well below estimates of 205K. That is the third week in a row where claims have come in below forecasts by at least 10K. That is something that has only happened two other times in the past decade; once in 2009 and again in 2014. Whereas this is the second straight week of sub-200K readings, it is also the 80th straight week of readings at or below 250K (the second best streak on record) and 215th below 300K (a record streak). Continuing Claims are mirroring strong initial claims coming in at their strongest level since October of last year.
(Click on image to enlarge)
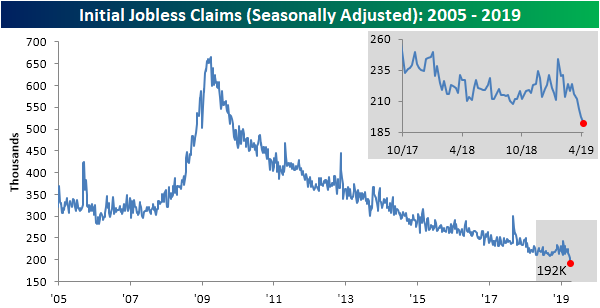
The four-week moving average has continued to fall coming in at 201.25K this week versus last week’s 207.25K. Both this week and last were new 52-week lows and lows for the cycle. That is something we have not seen since last September when we saw four weeks of 52-week lows in a row beginning on August 31st. This week’s number is also the lowest the moving average has been since 1969. Given these new lows, jobless claims data looks very strong and the prior highs seen earlier this year can more confidently be called a blip rather than a new trend.
(Click on image to enlarge)

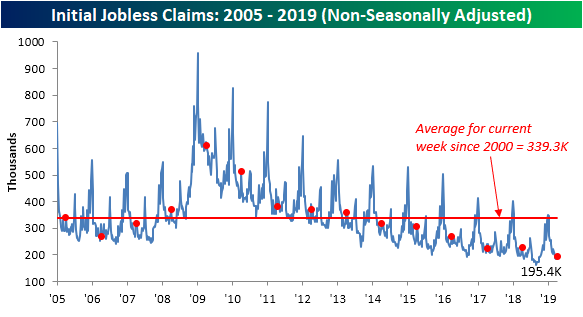
Turning to the non-seasonally adjusted data, claims fell by just over 1K down to 195.4K. This decline was to a much smaller degree than previous years for the current week of the year but is still the lowest for the current week of the year since 1969.
(Click on image to enlarge)
Start a two-week free trial to Bespoke Premium to access our interactive economic indicators monitor and much ...
more

