

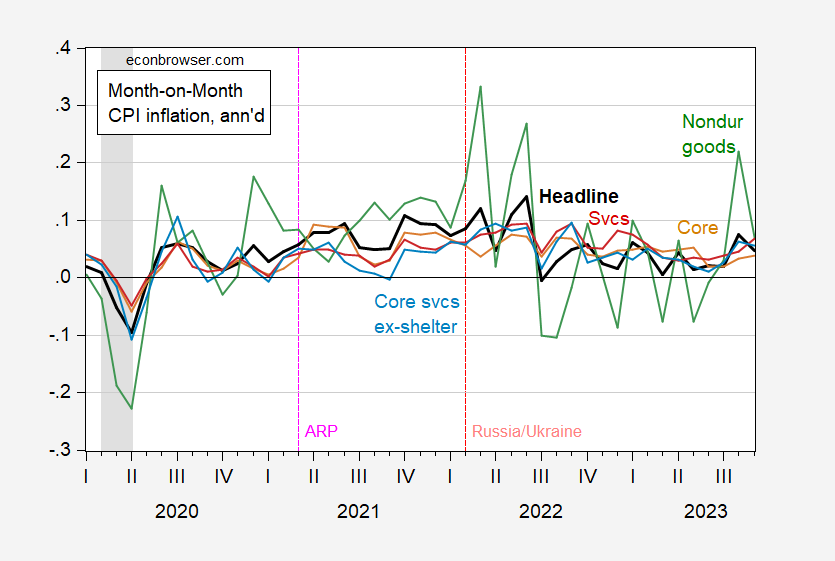
Month-on-month services inflation after January 2020 is more persistent than nondurable goods inflation (0.68 vs. 0.38). And services core inflation ex-housing is less persistent, at 0.50.
(Click on image to enlarge)
Figure 1: Month-on-Month CPI headline inflation (black), core (tan), nondurable goods (green), services (red), core services ex-shelter (light blue), all annualized. NBER defined peak-to-trough recession dates shaded gray. Source: BLS, Pawel Skrzypczynski, NBER, and author’s calculations.
Interestingly, while nondurables persistence is roughly the same pre- vs. post-pandemic, services persistence is higher in the recent period (0.68 vs. 0.42). In other words, the ranking of inflation persistence by category is not invariant to the sample period, as one would expect since persistence is not a structural parameter.
In sum, the AR(1) coefficients for each category (2020M01-2023M09) for m/m inflation are:
- Headline: 0.54
- Core (52% of total): 0.65
- Durable goods (12% of total): 0.68
- Nondurable goods (26% of total): 0.38
- Services (62% of total): 0.68
- Core services ex-shelter (27% of total): 0.50
- BLS supercore (42% of total): 0.58
More By This Author:
Real Wage Growth And Inflation Prospects
GDP in Q3: Relative To Nowcasts, And Alternative Estimates
Strong GDP Growth And Consumer Spending


Comments
Log in or sign up to join the conversation.