
Inflation In January 2022
Headline and core both surprise on the upside, 0.6% m/m vs. 0.5% Bloomberg consensus. You’ll hear lots about “records”, which are accurate but focus on y/y inflation. Here’s some context:
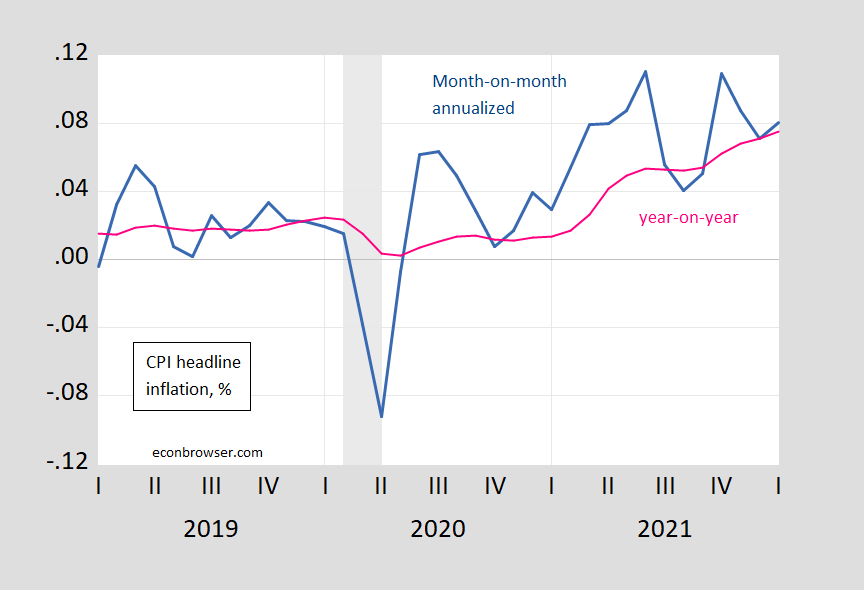
Figure 1: CPI month-on-month inflation rate, annualized (blue), 12 month or year-on-year inflation rate (pink), in decimal form (i.e., 0.05 means 5%). NBER defined peak-to-trough recession dates shaded gray. Source: BLS, NBER, and author’s calculations.
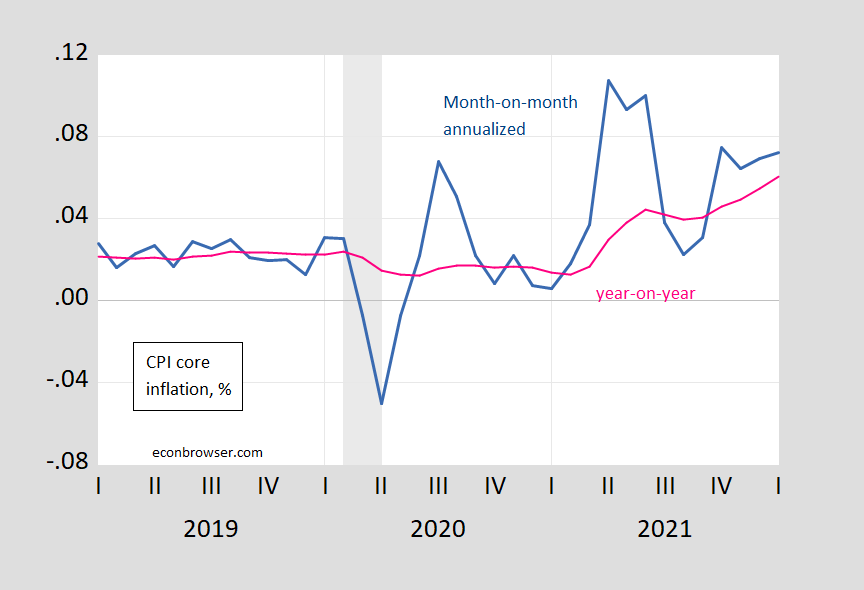
Figure 2: CPI core month-on-month inflation rate, annualized (blue), 12 month or year-on-year inflation rate (pink), in decimal form (i.e., 0.05 means 5%). NBER defined peak-to-trough recession dates shaded gray. Source: BLS, NBER, and author’s calculations.
The month-on-month headline is down relative to November, even if it surprised on the upside; the core is not declining, which is a bit more worrisome for y/y core inflation going forward.
For the long perspective, here’s a headline over 65 odd years:
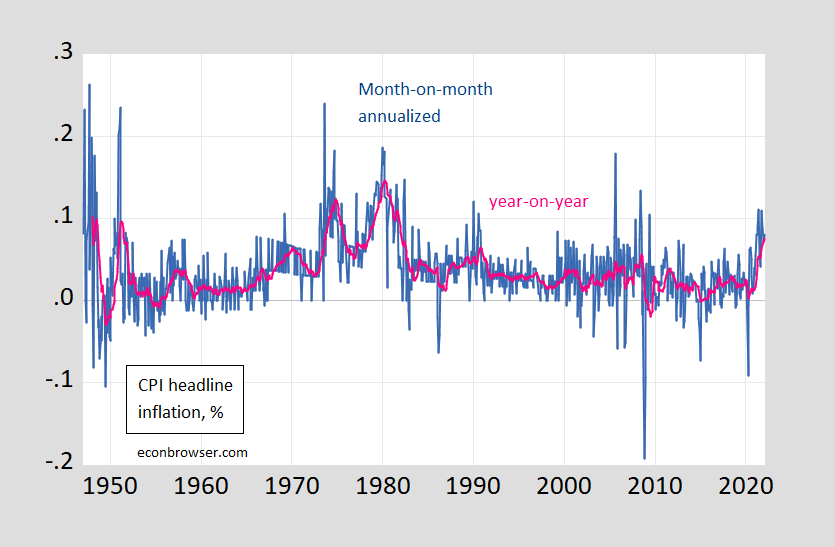
Figure 3: CPI month-on-month inflation rate, annualized (blue), in decimal form (i.e., 0.05 means 5%). NBER defined peak-to-trough recession dates shaded gray. Source: BLS, NBER, and author’s calculations.
CEA Twitter thread here. More on trimmed mean and sticky price inflation coming.
Disclosure: None.


