Industrial Production ‘Meh’ In February, But Down Sharply Since Last Summer
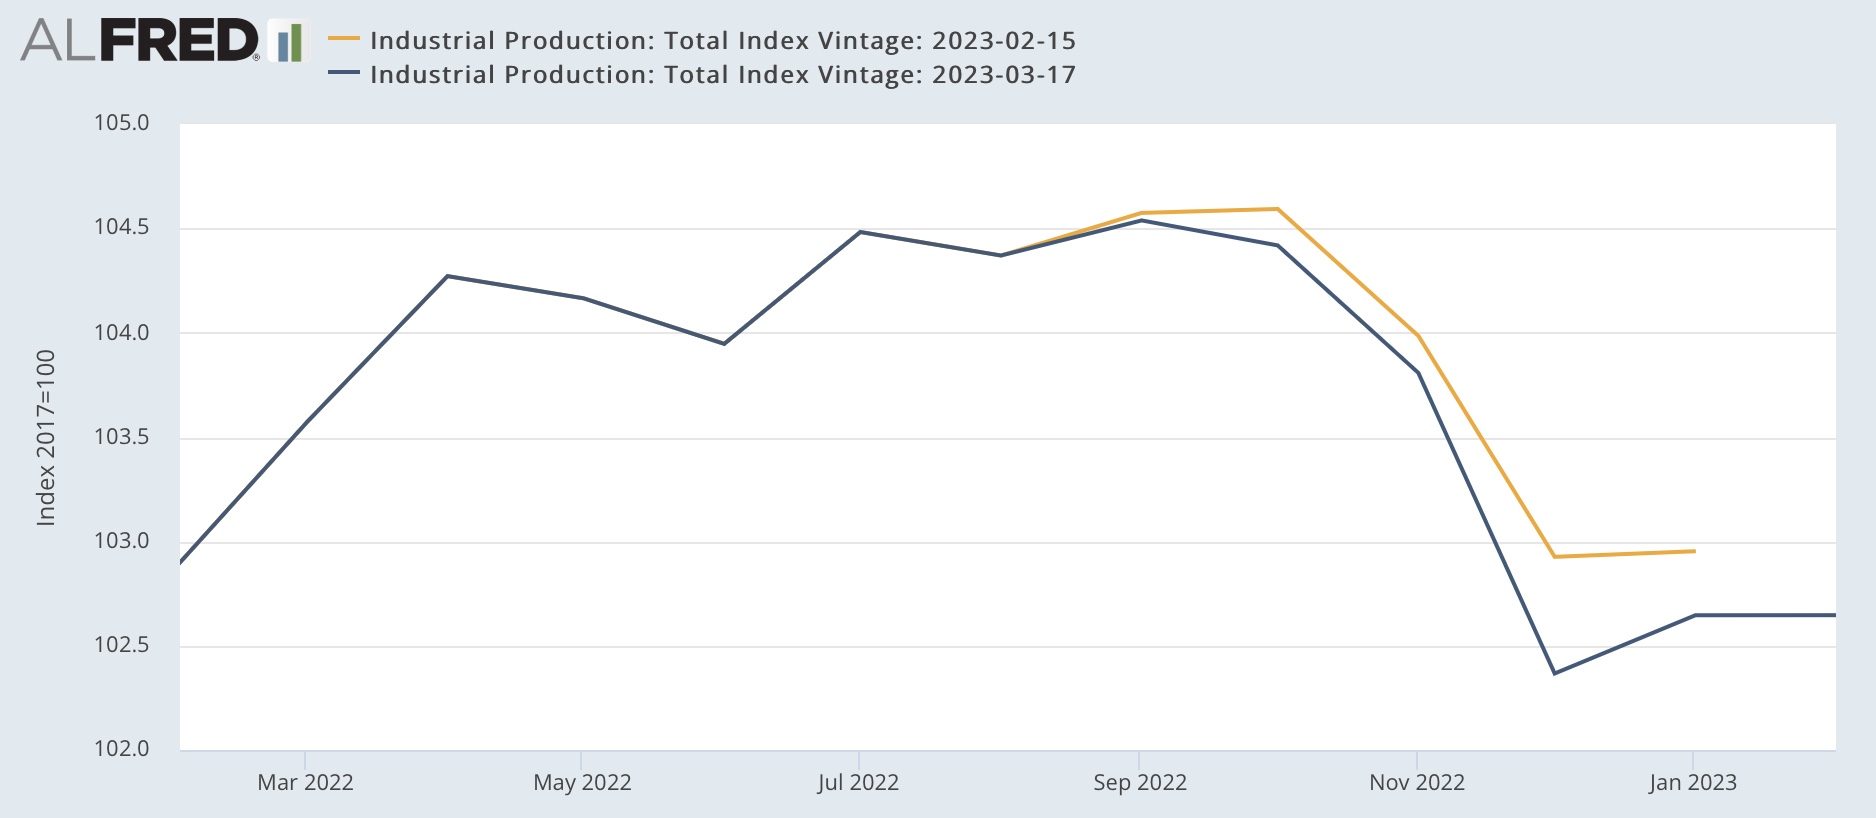
Industrial production was unchanged for the month of February while manufacturing production rose +0.1%. But the bad news is that both were revised lower for the past 5 months, as shown in the two graphs below:
(Click on image to enlarge)

(Click on image to enlarge)

As a result, industrial production (blue below) is now -1.8% below its September peak, while manufacturing production (red) is -2.0% below its peak from last April:
(Click on image to enlarge)

With the exception of 1966, before 1990 such declines would always have been recessionary. Since then, because manufacturing has shrunk so much as a percentage of the overall economy, both in 2016 and 2019 there were bigger declines without there being a recession. Still, this is one of the 4 main coincident indicators relied on by the NBER in determining if the economy is in recession.
Industrial production is also the missing component I needed to make the first, preliminary estimate of real manufacturing and trade sales for February.
Recall that we won’t even get the “official” measure for January until the deflators for personal income and spending are reported on the 31st. But we already have real retail sales for February, so what is missing are manufacturing and wholesaler sales for that month, minus the deflator. Industrial production fills in the manufacturing component, with the exception that we don’t know the relative inventory change vs. sales for that month.
Without further ado, here is what the average of industrial production + real retail sales look like for the past 30 years compared with real manufacturing and trade sales:
(Click on image to enlarge)

Both the trend and the typical monthly change are reasonably close.
Now here is the percentage change for the last 22 months:
(Click on image to enlarge)

This method is not so accurate as the 2nd estimate I discussed several days ago, but does give us the main thrust. Like the 2nd estimate, for January it forecasts a sharp increase (+1.5% vs. the +0.8% of the 2nd estimate), followed by a -0.4% decrease in February. Like the 2nd estimate, it indicates a new record high for January.
As I wrote the other day, we’ll see how this forecast plays out on the 31st for January, and at the end of April for February.
More By This Author:
Housing Construction: Good News And Bad NewsJobless Claims: Nobody Is (Still!) Getting Laid Off
Forecast: Real Manufacturing And Trade Sales Are Likely To Set A New Record For January
Disclaimer: This blog contains opinions and observations. It is not professional advice in any way, shape or form and should not be construed that way. In other words, buyer beware.


