

Image Source: Pixabay
Di Martino Booth points to the McKelvey rule, which uses a 0.3 ppt threshold instead of the Sahm 0.5 ppt threshold. This indicator does seem to signal a recession as shown in the figure below.

Source: DiMartino Booth (2024).
Notice there are no false negatives. However, this graph (apparently) uses revised data. In real time, one would get a different set of results, as shown in Figure 1 below.
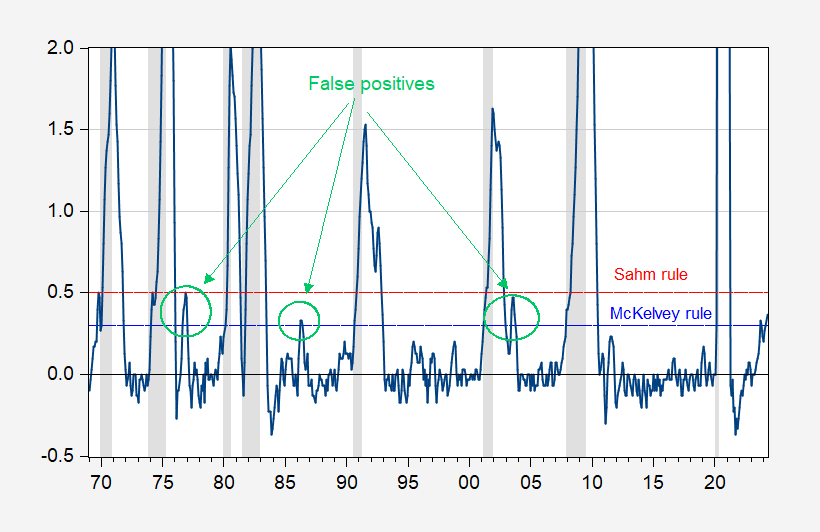
Figure 1: Real time 3 month moving average of unemployment rate relative to lowest rate in previous 12 months, in ppts (blue). NBER defined peak-to-trough recession dates shaded gray. Source: FRED, NBER.
Using the real-time data, there are three false positives (circled in green). So when the real-time indicator signals a recession using a 0.3 ppts threshold, it’s important to realize this indicator has yielded false positives.
More By This Author:
May 2024 Short Term Energy Outlook: WTI, Gasoline PricesConsumption Per Capita Relative To Trend
Decomposing Sentiment


Comments
Log in or sign up to join the conversation.