

Image Source: Unsplash
Remember that the Preliminary Benchmark Revision is… Preliminary. While this is obvious, the implications are not necessarily so. In particular, if one is interested in measuring the actual number of jobs filled by both documented and undocumented workers, then one should understand that the preliminary revision will likely tend to undercount employment. That is because the main input into the preliminary revision is unemployment insurance data, which will tend to be lacking for undocumented workers.
With this in mind, let’s examine the Preliminary Benchmark Revision relative to the official series:
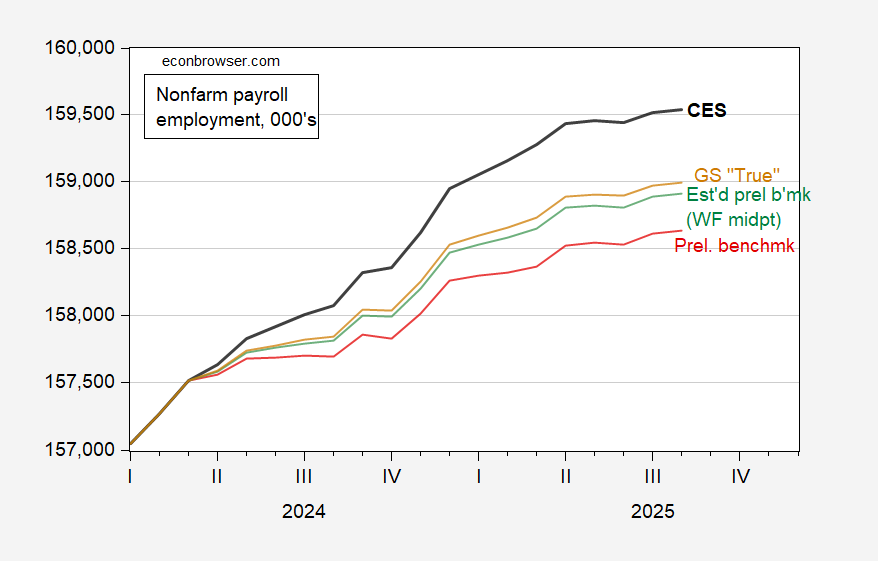
Figure 1: Nonfarm payroll employment as reported by CES (bold black), Preliminary benchmark revision with monthly changed “wedged in” over the 2024M03-25M03 period (red), estimated preliminary benchmark using midpoint of Wells Fargo estimated revision (green), and GS estimate of final benchmark revision (tan), all in 000’s, s.a. Source: BLS via FRED, BLS, Goldman Sachs, Wells Fargo, author’s calculations.
From Goldman Sachs today;
We think the estimate likely revises payroll growth down by too much, for two reasons. First, as we noted last year, since the QCEW is based on unemployment insurance records, it likely excludes many unauthorized immigrants, who contributed strongly to employment growth over the last few years. Undercounting of unauthorized workers should be less of an issue going forward given the sharp slowdown in immigration. Second, the QCEW itself has been revised up in every quarter since 2019 with the exception of 2020H1. The first chart below shows that the preliminary estimate for the benchmark revision has correspondingly been below the final revision in each of the last five years, by 119k on average. Revisions to the QCEW are one reason why the BLS only benchmarks the payrolls data to the QCEW annually and with a fairly long lag.
Our own model of net job gains from firm births and deaths—one of the key points of uncertainty in monthly payrolls growth that the benchmarking process corrects for—based on higher-frequency business formation and bankruptcies data as well as detailed data from the business employment dynamics (BED) program, suggests a downward revision of around 550k or 45k per month via that channel would be justified. That estimate implies that monthly job growth over this period may have been closer to 100k than the initially reported 147k, but not as low as the 71k pace implied by the revisions. While the BLS’s birth-death adjustment for nonfarm payrolls was probably too generous in 2024H2, we estimate that the overstatement has since narrowed to around 10k jobs/month, cautioning against extrapolating too much from the benchmark revision.
The 550K downwardly revised trajectory is shown as the tan line in Figure 1. Assuming one is more interested in total NFP (rather than just documented employment), then tan line is more appropriate; this is pretty close to the “guess” I had using the Wells Fargo midpoint, represented by the green line.
So, for a guess of where the final NFP (post-benchmark revision) will end up, look to the tan line in Figure 1.
How does the preliminary benchmark revision compare to the level implied by the CPS based series adjusted to the NFP concept? The two series are shown in Figure 2.
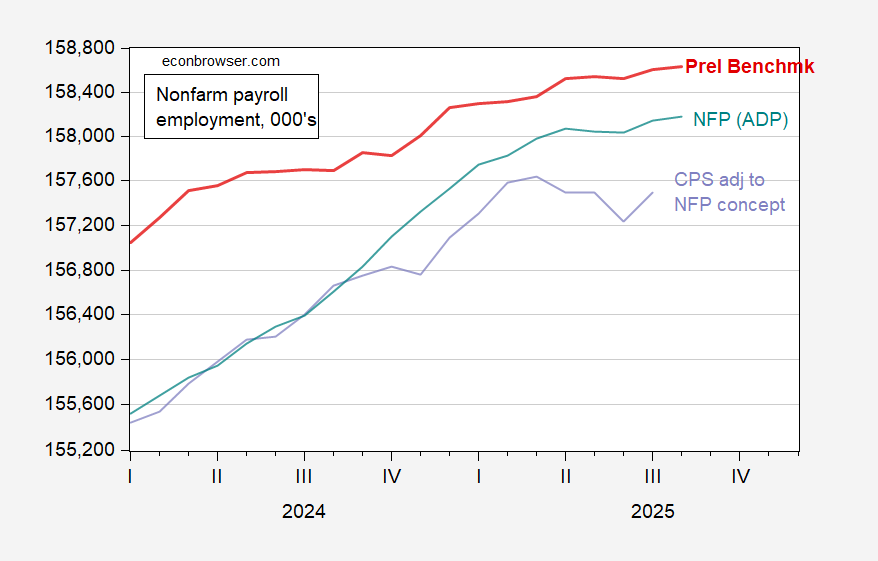
Figure 2: Nonfarm payroll employment in Preliminary benchmark revision with monthly changed “wedged in” over the 2024M03-25M03 period (red), CPS series adjusted to NFP concept, centered 3 month moving average (lilac), and private NFP from ADP summed with BLS government employment, all in 000’s, s.a. Source: BLS, ADP via FRED, BLS, author’s calculations.
The CPS based series provides and even more grim picture than the CES preliminary benchmark, especially starting in March 2025. On the other hand, the ADP plus BLS government series (a quasi total NFP) tracks the preliminary benchmark pretty well.
Finally, practice is to “wedge in” the average monthly changes into the 2024M03-2025M03 period. We can use the actual QCEW series (now reported up to March) to judge how essentially documented, covered, and employment has changed.
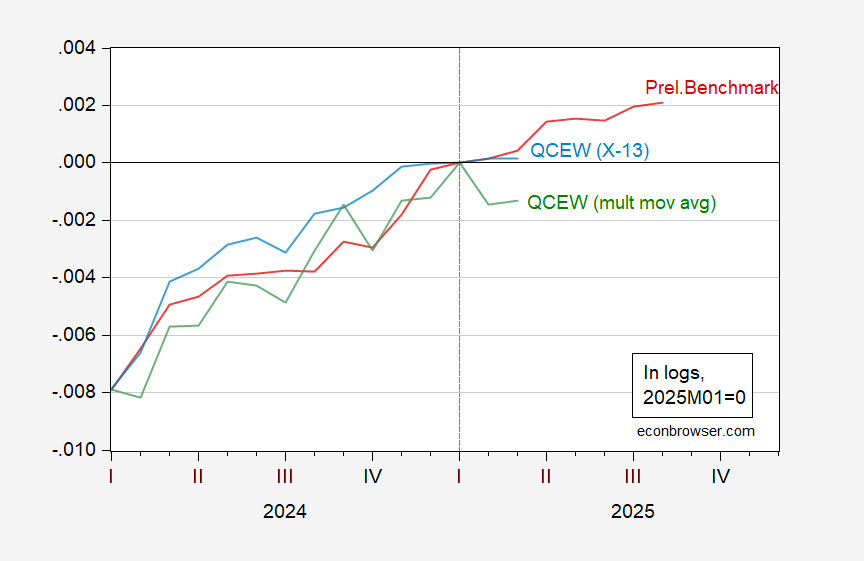
Figure 3: Nonfarm payroll employment in Preliminary benchmark revision with monthly changed “wedged in” over the 2024M03-25M03 period (red), fitted NFP using QCEW covered employment, seasonally adjusted by author using X-13 2021M03-2024M03 (light blue), fitted NFP using geometric moving average (green), all in logs 2025M01=0. Fit regression estimated 2024M03-2025M03. Source: BLS via FRED, BLS, author’s calculations.
Depending on the seasonal adjustment method used, QCEW covered employment has been flat over the first quarter, or dropping.
Cut either way, employment growth has declined.
If we had adopted the Antoni suggestion to do quarterly releases (presumably based on QCEW), then we’d have a picture of employment that is equal to, or worse than, the current benchmark revision…
More By This Author:
“The Misuse Of Statistics” Module In Stats ClassIs The U.S. Already In Recession?
Employment In The Context Of Business Cycle Indicators


Comments
Log in or sign up to join the conversation.