

Moving averages will help traders:
- Identify trends
- Determine support and resistance levels
- Generate trading signals
- Confirm existing trading signals
In this article, we'll look at moving averages, including the different types, how to use them on trading platforms, and popular trading strategies. We'll also discuss common mistakes and problems to avoid, as well as the importance of backtesting and optimization.
Types of Moving Averages
The three main types of moving averages are:
Simple Moving Average (SMA)
Let's chat about three popular moving averages: Simple Moving Average (SMA), Exponential Moving Average (EMA), and Weighted Moving Average (WMA). They're like your trusty sidekicks in the market, helping you navigate the ups and downs of prices.
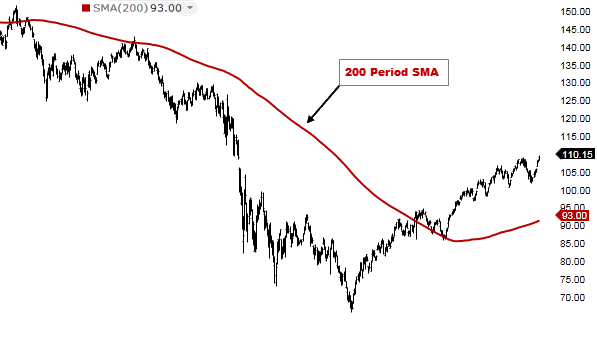
Simple Moving Average (SMA)
Think of the SMA as your chill, laid-back friend who takes life at his own pace. He calculates the average price over a specific period (like the last 200 days), smoothing out all the market noise.
Pros:
- Simple to understand and calculate.
- Good for identifying long-term trends and support/resistance levels.
- Less prone to generating false signals compared to others.
Cons:
- Slow to react to price changes, making it less effective for short-term trades.
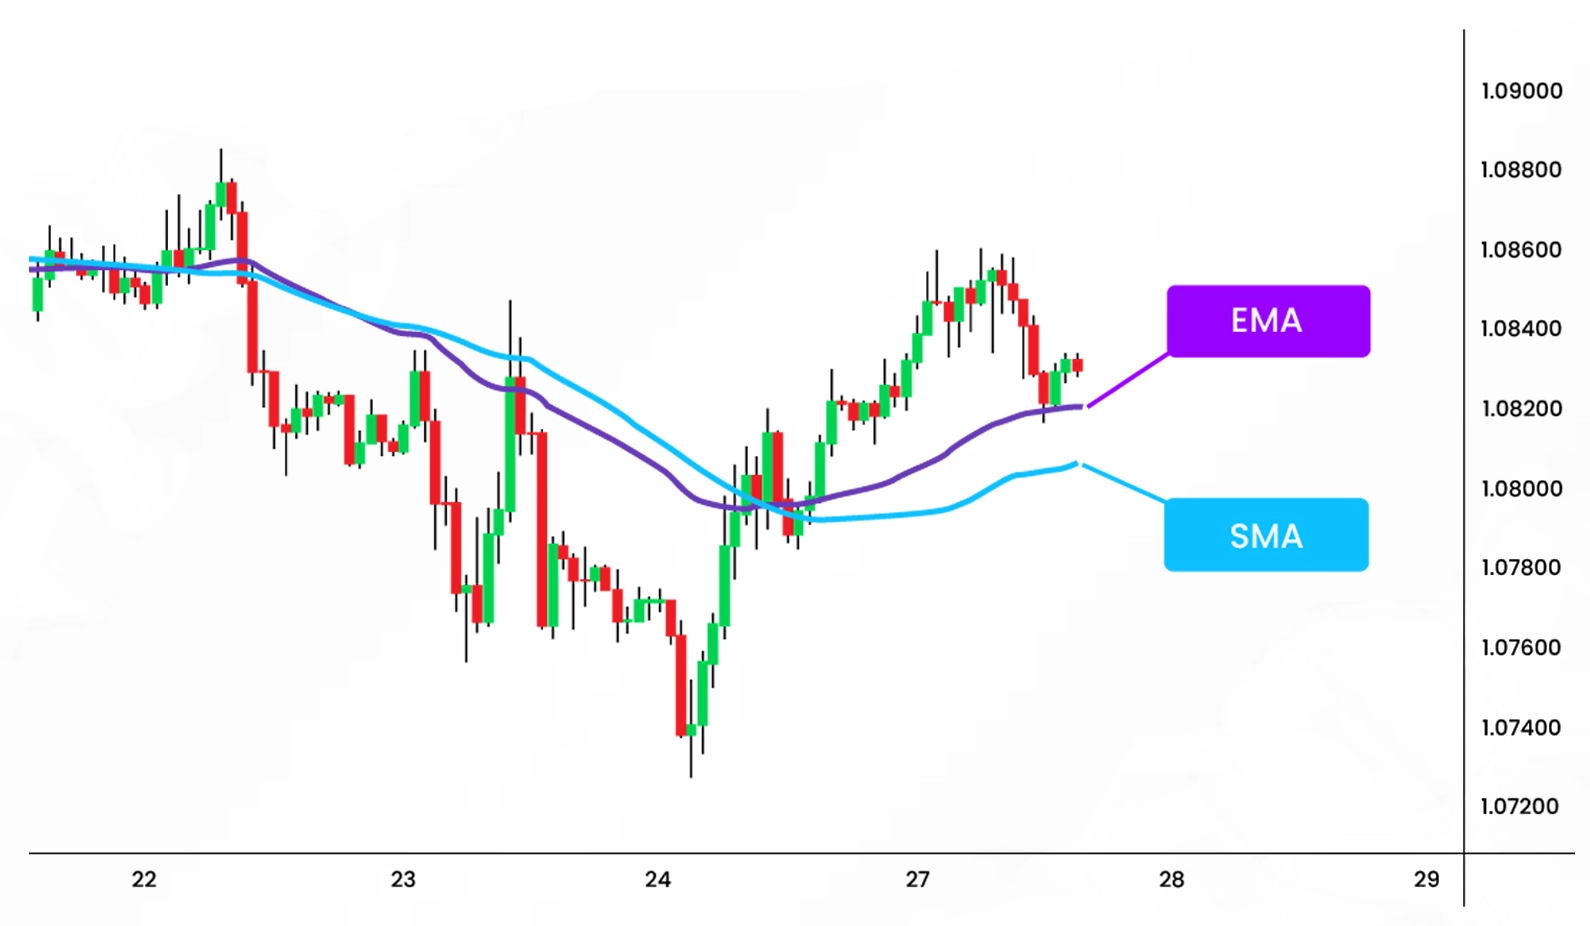
Exponential Moving Average (EMA)
The EMA is your energetic friend who's always up-to-date on the latest market trends. He gives more weight to recent prices, making him more responsive to change.
Pros:
- Reacts faster to price changes, making it ideal for short-term trading.
- Effective for identifying trend reversals and breakouts.
Cons:
- More prone to false signals than the SMA, especially in choppy markets.
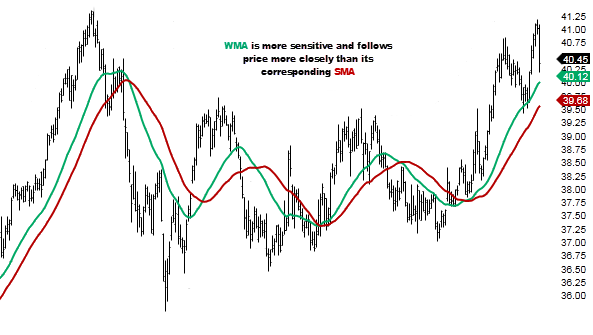
Weighted Moving Average (WMA)
The WMA is your friend who loves data and uses it to his advantage. He assigns different weights to each price in the averaging period, usually based on volume, time, or a combination of both. This makes him more accurate in identifying trends, especially in volatile markets.
Pros:
- More accurate in identifying trends than SMA and EMA, especially in volatile markets.
- Gives more weight to important data points like volume.
Cons:
- More complex to calculate than SMA and EMA.
- May not be as intuitive to interpret for beginners.
Strategies for Trading with Moving Averages
There are many different trading strategies that use moving averages. Let's look at some of them:
Moving Average Crossovers
- Golden Cross and Death Cross: The Golden Cross occurs when the short-term moving average crosses below the long-term moving average, and the Death Cross occurs when the short-term moving average crosses below the long-term moving average.
- How to interpret and use crossover signals: Crossover signals can be used to identify trend reversals and breakouts. For example, the Golden Cross can be interpreted as a bullish signal indicating that a trend reversal may occur.
Moving Average Support and Resistance
- Moving averages can be used to identify key support and resistance levels.
For example, the 200-period SMA is often used as a key support level for instruments. - Using moving averages to confirm a trend.
For example, if a stock is trading above its 200-period SMA, it is likely in an uptrend.
Moving Average Divergence
- Recognizing divergence patterns. Moving average divergence occurs when the price of a security moves in one direction but the moving average moves in the opposite direction. This could be a sign that the current trend is losing momentum and may be about to reverse.
- Implications for trading decisions: Divergence patterns can be used to generate trading signals or to confirm existing trading signals. For example, if a stock is making higher highs and the moving average is making lower highs, it could be a sign of bearish divergence and a potential trend reversal.
Combining Moving Averages with Other Indicators
Moving averages need to be combined with other technical indicators to create more robust trading strategies. Relative strength index (RSI) and moving average divergence (MACD) are two popular indicators that can be used in conjunction with moving averages to generate trading signals and confirm trends.
Risk Management and Trade Entry/Exit
You should practice risk management when trading with moving averages.
Should only risk a small percentage of your trading capital on any given trade. You should use stop-loss and take-profit orders to limit your losses and protect profits. And the last one is setting up clear entry and exit rules. This will help to prevent emotional trading decisions.
Examples of using moving averages in trades
Long trade example
Let’s say you identify a bullish trend in a stock using a 200-period SMA. The stock is trading above the SMA and is making higher highs. And you decide to enter a long trade at the next swing high, then you place a stop-loss order below the previous swing low and a take-profit order at the next resistance level.
Short trade example
Let’s say you identify a bearish trend in a stock using a 200-period SMA. The stock is trading below the SMA and is making lower lows. You decide to enter a short trade at the next swing low and place a stop-loss order above the previous swing high and a take-profit order at the next support level.
Moving Averages: Examples
Here are twocase studies of how moving averages can be used to generate trading signals:
Case study:
In March 2020, the stock market experienced a sharp sell-off due to the COVID-19 pandemic. The S&P 500 index fell below its 200-period SMA for the first time in over a decade. This was a bearish signal that indicated that the market could continue to decline in the short term.
Case study:
In January 2023, the S&P 500 index broke above its 200-period SMA after a several-month consolidation period. This was a bullish signal that indicated that the market could continue to trend higher in the short term.
Common Traps and Challenges
Over-optimization and curve-fitting
Over-optimization and curve-fitting are two common traps that you will make when using moving averages. Over-optimization happenes when you optimize moving average parameters on historical data until they produce the best possible results. Curve-fitting occurs when a you adjust moving average parameters to fit a specific market condition.
Both of these traps can lead to false signals. It is important to backtest moving average strategies on historical data, but it is also important to avoid over-optimization and curve-fitting.
Dealing with whipsaws and false signals
All trading strategies generate false signals from time to time, it happens. This is especially true for strategies using moving averages. Moving averages can lag behind price action, which can lead to false signals in unstable markets.
So, it is important to be aware of the potential for false signals and to use risk management techniques to mitigate their impact.
Emotional discipline and patience
Emotional discipline and patience are essential for successful trading. You should avoid making impulsive trading decisions based on a single moving average signal. Instead, you should use moving averages in conjunction with other technical indicators and risk management techniques.
Backtesting and Optimization
Backtesting is the process of testing a trading strategy on historical data. Which can be done using a demo trading account or by backtesting the strategy on a trading platform.
To backtest a moving average strategy, you will typically need to:
- Choose a moving average type and period.
- Identify the entry and exit rules for the strategy.
- Simulate the strategy on historical data to see how it would have performed.
Optimizing moving average parameters
Once you’ve backtested a moving average strategy, you may want to optimize the moving average parameters, such as the period and type. This can be done by backtesting the strategy with different parameters and seeing which ones produce the best results.
When interpreting backtest results, you should consider the following:
- The win rate of the strategy: This is the percentage of trades that were profitable.
- The average profit and loss per trade: This will give traders an idea of how much money they could expect to make or lose on each trade.
- The maximum drawdown: This is the largest percentage loss that the strategy experienced during the backtest period.
You should also look for any patterns in the backtest results. Strategy may perform better in certain market conditions than others.
Conclusion
So what we have, moving averages help you see the big picture by smoothing out all the ups and downs, and they come in three different flavors: simple, energetic, and super responsive.
But remember, even this indicator has limitations. Moving averages occasionally give bad advice and aren't magic wands for profit. So, use them wisely and don't forget the golden rules of trading: manage risk, adapt to your style, and always have a clear plan.
With moving averages by your side and a smart approach, you'll be navigating the market like a pro.
The best way to learn how to use moving averages effectively is to practice trading with them on a demo trading account. Once a trader has gained some experience and confidence, they can start trading with real money.
More By This Author:
Energy Stocks Face Headwinds In 2024: Analysts Predict Price Downturn
Technical Analysis Of USDCAD: Buy Or Sell?
Channel Trading Forex


Comments
Log in or sign up to join the conversation.