
Both the Federal Reserve and the Bank of Canada are indicating a shift in their stance towards a more neutral position, likely due to the recent economic data showing signs of slowing growth and easing inflation. While neither central bank has yet lowered interest rates, both markets are anticipating rate cuts to begin as soon as early 2024.
Fed
- Left rates unchanged and stressed cautious policy due to lagging effects of tightening.
- Recent data shows disinflationary progress (Core PCE) and weakening labor market (Continuing Claims, NFP).
- Hawkish Fed members shifting to neutral stance.
- Market expects rate cuts to start in Q1 2024.
BoC
- Left rates unchanged but prepared to raise further if needed.
- Governor Macklem delivered less hawkish speech.
- Recent CPI data missed expectations and showed easing inflation.
- Labor market report beat expectations but unemployment rate ticked higher.
- Market expects rate cuts to start in Q2 2024.
Overall, the economic data and central bank actions suggest a cautious approach to monetary policy moving forward, with potential rate cuts on the horizon in both the US and Canada.
Daily Timeframe
(Click on image to enlarge)
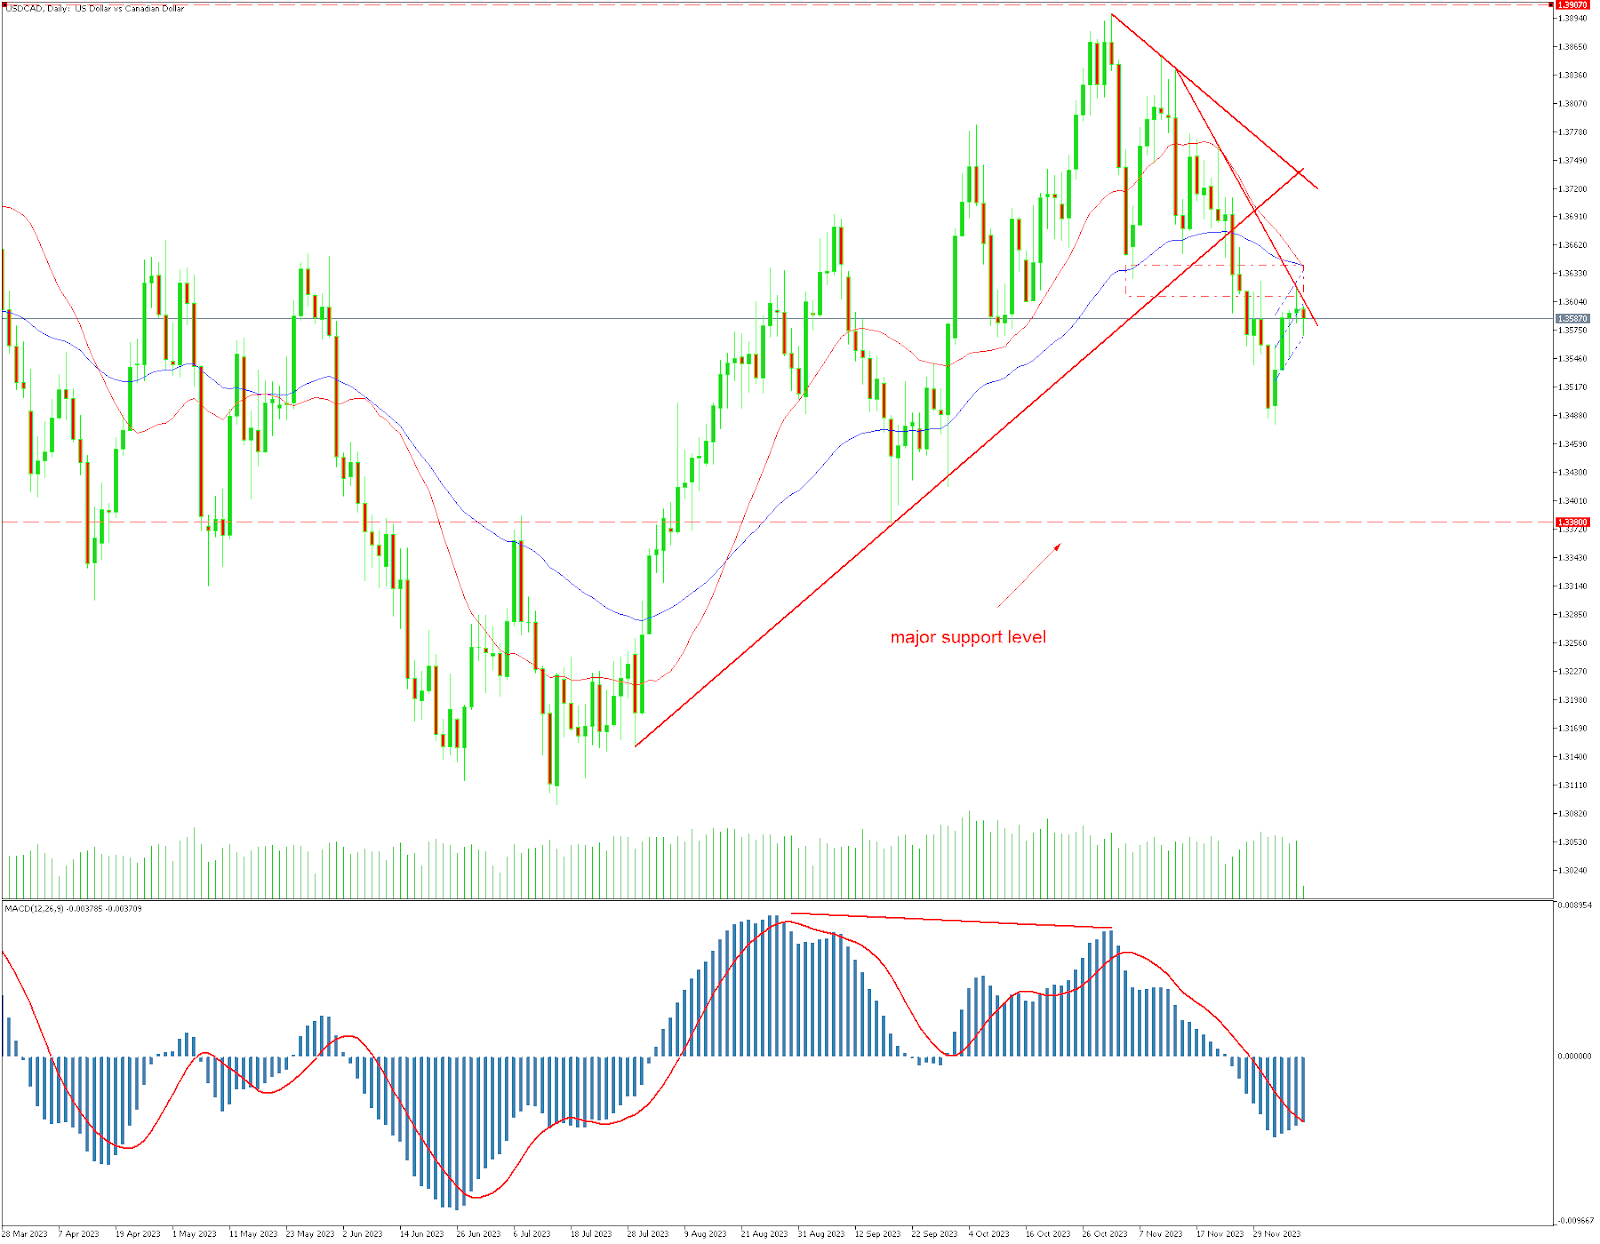
The USDCAD chart shows a clear downward trend since the pair broke below a key trendline. This selling pressure has been driven by two main factors:
- Weakening US data: Recent data releases, including the ISM Manufacturing PMI and NFP report, have missed expectations and pointed towards a slowing US economy.
- Aggressive rate cut pricing for the Fed: The market is now anticipating the Fed to start cutting interest rates as soon as Q1 2024, which has weakened the USD.
Target for sellers
The next major support level for the pair is the swing low around 1.3382. If the downtrend continues, this level could be tested in the coming weeks.
Potential trend reversal
There are a few factors that could lead to a reversal of the current downtrend:
- Stronger US data: If upcoming data releases come in better than expected, it could boost the USD and help the USDCAD pair recover.
- More hawkish Fed stance: If the Fed indicates a willingness to keep interest rates higher for longer, it could strengthen the USD.
- Risk-off sentiment: If global risk sentiment deteriorates, investors may seek the safety of the USD, which could lead to a rebound in the USDCAD pair.
Key Takeaways
- The USDCAD pair is currently in a downtrend following a break below a key trendline.
- This trend is being driven by weak US data and expectations of Fed rate cuts.
- The next major support level is 1.3382.
- The trend could reverse if we see stronger US data, a more hawkish Fed, or a deterioration in risk sentiment.
It is important to monitor these factors closely to identify potential turning points in the USDCAD trend.
4 Hour Timeframe
(Click on image to enlarge)
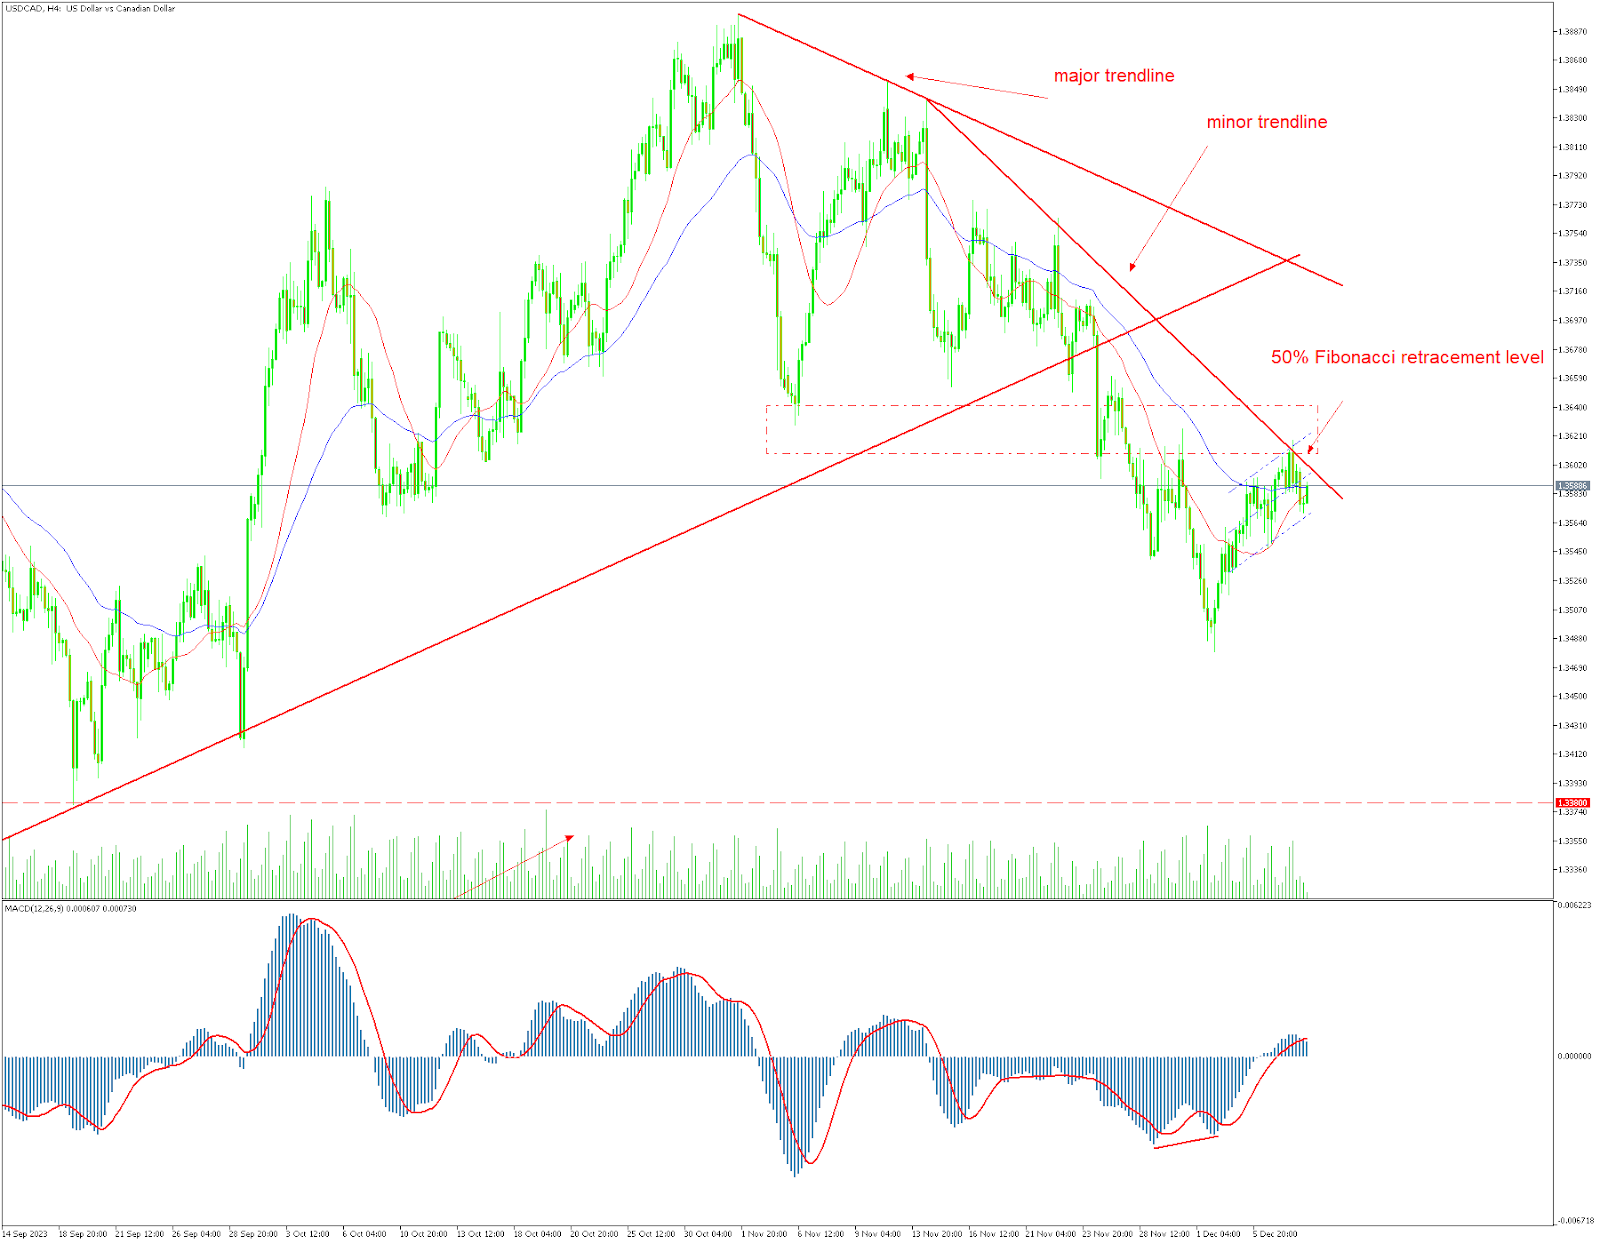
Divergence
- The "latest leg lower" refers to a recent downward movement in the price of USDCAD.
- This downward movement "diverged" with the MACD indicator, which means the MACD indicator did not move down as significantly as the price.
- This divergence is considered a "sign of weakening momentum," suggesting that the downward trend might be losing strength.
Pullback and Resistance
- After the divergence, the price of USDCAD experienced a "pullback," which is a temporary upward movement against the prevailing downward trend.
- This pullback stopped at a "minor trendline" around the 1.3565 level.
- This trendline is considered a point of resistance, meaning sellers are likely to be more active here, trying to push the price down again.
Potential Scenarios
- If the price of USDCAD breaks below the 1.3565 level, it would signify a continuation of the downtrend, with the next target being "new lows."
- However, if the price breaks above the 1.3565 level, it would suggest buyers are gaining control, potentially leading to a "correction" upward.
- This correction could have a target of the "major trendline" around the 1.3640 level.
- At the 1.3640 level, the price would also encounter the "50% Fibonacci retracement level," which is another potential point of resistance based on historical price movements.
Confluence
- The term "confluence" refers to the intersection of multiple technical indicators at the same price level.
- In this case, the major trendline and the 50% Fibonacci retracement level are both located at 1.3640, creating a stronger resistance zone.
Overall
The analysis suggests a potential reversal in the short-term trend of USDCAD, but the direction will depend on whether the price breaks above or below the 1.3565 level. The 1.3640 level presents a significant resistance zone where sellers may try to push the price back down again.
Note: Technical analysis is not a perfect predictor of future price movements, and it is always important to consider other factors and market conditions before making any trading decisions.
More By This Author:
Channel Trading Forex
How To Trade Stocks During A Market Crash
The Potential For Long-Term Growth Of Telus Stock


Comments
Log in or sign up to join the conversation.