

Image Source: Pexels
The Summer 2025 Journal of Wealth Management study “Blinded By Bias: The Effects of Hindsight and Survivorship Biases in Managed Futures” by Joel Handy and Lorent Meksi investigated how two common behavioral biases—hindsight bias and survivorship bias—affect investors’ decisions when selecting Commodity Trading Advisors (CTAs). Handy and Meksi focused on the manager selection process, analyzing whether choosing CTAs based on strong past performance led to superior future results, or if these biases caused investors to make poor choices.
Study Design and Methodology
The authors used a 20-year history of the SocGen CTA Index, which includes the largest and most institutional CTAs, to simulate real-world manager selection. Each year, they created hypothetical portfolios by picking the top 1, 3, and 5 managers based on their trailing 3-year return-to-risk ratios—using only information available at the time, just as an investor would. Using returns as reported to Barclayhedge, they then compared the portfolios’ past-year (back-tested) returns to their actual performance in the following year (out-of-sample), repeating this process annually from 2000 to 2021. The portfolios were reconstituted every year.
Key Findings
Past Performance Does Not Predict Future Results: The study’s simulations showed that CTAs who performed best in the recent past rarely maintain that outperformance in the future. For example, the top-performing manager or group of managers in one year often underperformed or even generated negative returns the next year, despite their stellar track records.
Hindsight Bias: Investors were prone to believe they could predict winners by looking at past results, but the data showed this confidence was misplaced. The impressive back-tested returns did not translate into future gains when portfolios were rolled forward.
Survivorship Bias: By focusing only on managers who have survived (remained in the index), investors ignored the many who dropped out due to poor performance or other reasons. This skews perceptions of how easy it is to pick winners and overstates the persistence of success. For example, 61% of the programs in the 2000 SocGen CTA Index are no longer in business. The following chart shows managers who have gone out of business after being a part of the SocGen CTA Index with each bar indicating the percentage of constituents from that year which are out of business.
Portfolio Performance Over Time: When the authors aggregated the annual results over two decades, the portfolios constructed from past winners consistently underperformed both the SocGen CTA Index and a diversified CTA fund-of-funds. The forward-looking returns were much lower than the returns implied by simply looking backward at past winners.
Charts from the paper show that forward-looking returns considerably underperformed both the index and the CTA fund of funds, providing a clear demonstration of single manager risk. Chasing the performance of the best performing manager from the previous year (the “Top 1” portfolio) turned out to be the worst performing strategy moving forward, demonstrating that outperformance among individual CTAs tends to lack persistence.
Key Takeaways for Investors
Don’t Chase Past Performance: Selecting CTAs (or any managers) based on recent outperformance is unlikely to yield better future results. Past winners do not reliably stay on top and chasing them can lead to disappointment.
Beware of Behavioral Biases: Hindsight and survivorship biases can cloud judgment, making investors overconfident in their ability to pick future outperformers. Recognizing these biases is crucial for better decision-making.
Diversification and Process Matter: Rather than relying on recent performance, investors should use a disciplined, diversified approach to manager selection. This reduces the risk of being misled by statistical noise and biases.
The Importance of Diversification
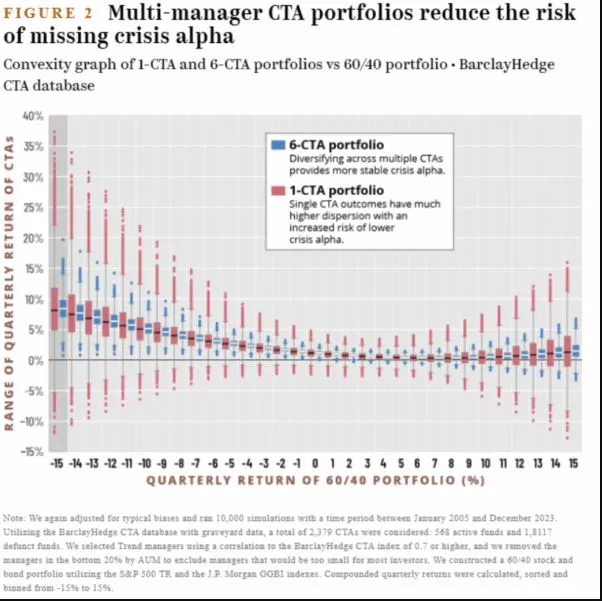
Joel Handy and Marat Molyboga of Efficient Capital Management demonstrated the importance of diversification in their 2024 study of all 35 trend managers included in the SG Trend index between January 2000 and December 2023. They conducted 10,000 simulations for both 1-CTA portfolios (portfolios with one CTA manager) and 6-CTA portfolios (with six managers). They repeated their analysis using the BarclayHedge CTA database, the largest publicly available database of CTA returns, after accounting for all typical biases. Again they used 10,000 simulations with a time period between January 2005 and December 2023. Trend managers were selected using correlation to the BarclayHedge CTA index of 0.7 or higher, and they removed the managers in the bottom 20% by AUM to exclude managers that would be too small for most investors.
The figure below compares the convexity of CTA returns (the “CTA smile”) based on the SG Trend index to those of a 60/40 portfolio. As one example, the distribution shows that if the 60/40 portfolio is down 15%, a 6-CTA portfolio has a distribution between 8-13%, whereas a 1-CTA portfolio performance could range between 2% and 25%.
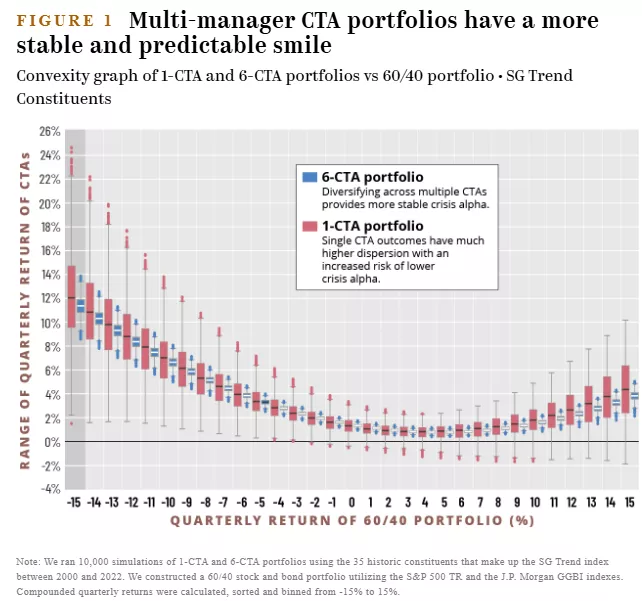

The results are hypothetical results and are NOT an indicator of future results and do NOT represent returns that any investor actually attained. Indexes are unmanaged and do not reflect management or trading fees, and one cannot invest directly in an index.
The next table shows the benefits of using a multiple manager strategy in reducing tail risks.
The next table shows the distribution of annualized returns of 1-CTA vs 6-CTA portfolios across the four crisis periods (2000-02, 2007-08, 2020, 2022)—once again demonstrating the prudence of diversification across CTA strategies and managers. The 6-CTA portfolio captured what the authors called “crisis alpha” in a more stable and predictable manner delivering annualized returns between 20% and 30%, while the performance of the 1- CTA portfolios was more unpredictable with the annualized returns ranging between 10% and 50%.
Investor Takeaways
- If you are going to include an allocation to trend following, given the observation of a strong dispersion of annualized returns among CTAs, you should consider diversifying across multiple CTAs (or trend following strategies).
- An investor in trend following must be prepared to experience long periods of poor performance. Mark Hutchinson and John O’Brien, authors of the 2014 study “Is This Time Different? Trend Following and Financial Crises,” covering almost 100 years, found that while trend following has tended to perform well in crises, it tends to perform poorly for extended periods post-crises. Thus, investors must be highly disciplined to benefit from the tail hedging properties of trend following. Of course, this is also true of every single risk strategy—otherwise there would be no risk and no risk premium. If you doubt that, consider that there have been three periods of at least 13 years—the 15 years from 1929 to 1943, the 17 years from 1966 to 1982, and the 13 years from 2000 to 2012—when the S&P 500 underperformed riskless one-month Treasury bills. Thus, discipline will be required to avoid abandoning the strategy—if you are subject to recency bias, relativity bias, or tracking variance regret don’t even think about an allocation to trend following.
Summary
Handy and Meksi provided a clear warning: relying on past performance to select CTAs is a strategy fraught with risk, largely due to behavioral biases that distort our perception of skill and persistence. For investors, the lesson is to stay humble, diversify, and focus on robust processes rather than chasing yesterday’s winners.
More By This Author:
Volatility Is A Reliable And Convenient Proxy For Downside Risk
Insider Trading Increases Market Efficiency
Enhancing Momentum Strategies


Comments
Log in or sign up to join the conversation.