Has American Economic Output Been In Decline Since 2022?

Image Source: Pexels
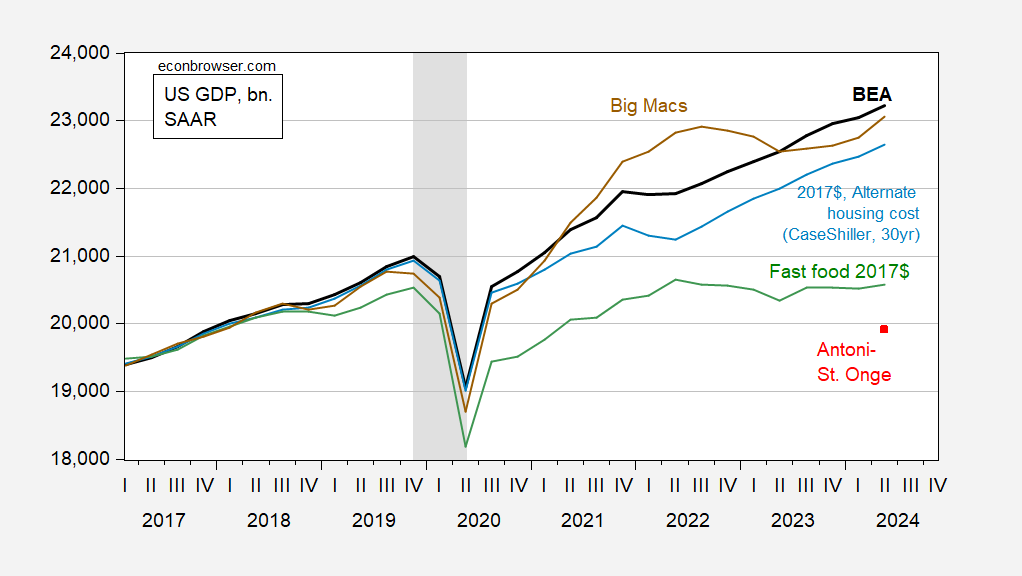
This is the premise of a new paper by Peter St. Onge and EJ Antoni. I have been trying to find a deflator that can yield that US GDP in 2024Q2 is 2.5% below 2019Q1 levels. Based on their discussion in their paper, as well as a video by Dr. St. Onge, I have tried calculating a consumption deflator that is based on house prices and mortgage rates, using the Big Mac price (which Dr. St. Onge lauds in his video as an alternative to official statistics or PWT data), and fast food prices (specifically, the food away from home/limited services restaurants component of the CPI).
Figure 1: GDP in Ch.2017$ (bold black), using alternative consumption deflator, housing-in-PCE weights (light blue), in 2017 fast food$ (green), in 2017 Big Macs (brown), and in 2017% per Antoni-St.Onge (red square), all in billions. Big Mac prices interpolated linearly. NBER defined peak-to-trough recession dates shaded gray. Source: BEA, BLS, NBER, and author’s calculations.
Deflating by fast food prices seems to come closest to the Antoni-St. Onge estimate.
More By This Author:
Big Mac Nation And Recession Since 2022Mid-October Reading On Business Cycle Indicators – NBER BCDC And Alternatives
Fed Inflation Credibility Measured


