
Image Source: Unsplash
The latest CPI release indicates a decline in food-at-home prices.
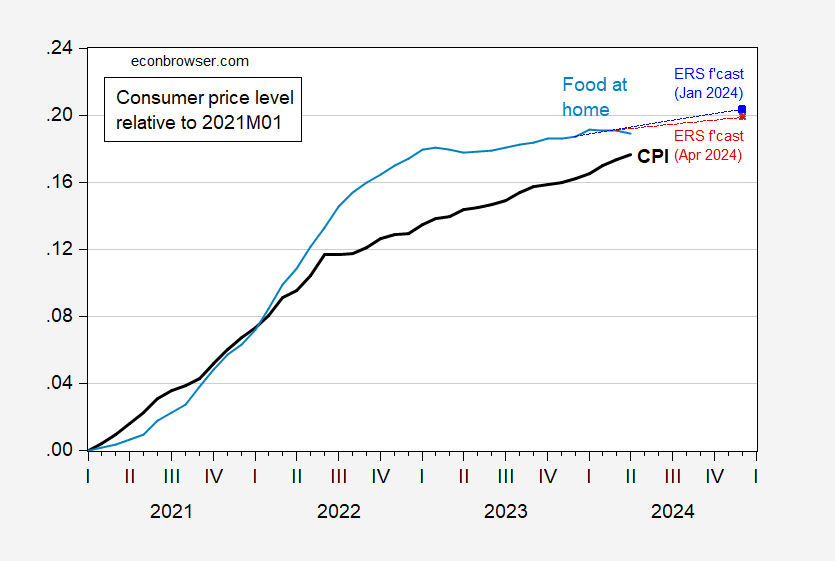
Figure 1: CPI (bold black), and food at home component (light blue), and ERS January forecast (blue square), all in logs, 2021M01=0. Source: BLS, ERS, and author’s calculations.
At the national level, the food-at-home component has been dropping for three months now. The USDA’s Economic Research Service (ERS) forecast for end-of-year CPI has consequently declined slightly.
A similar pattern of food price deceleration has occurred in the East North Central region (which encompasses Wisconsin).
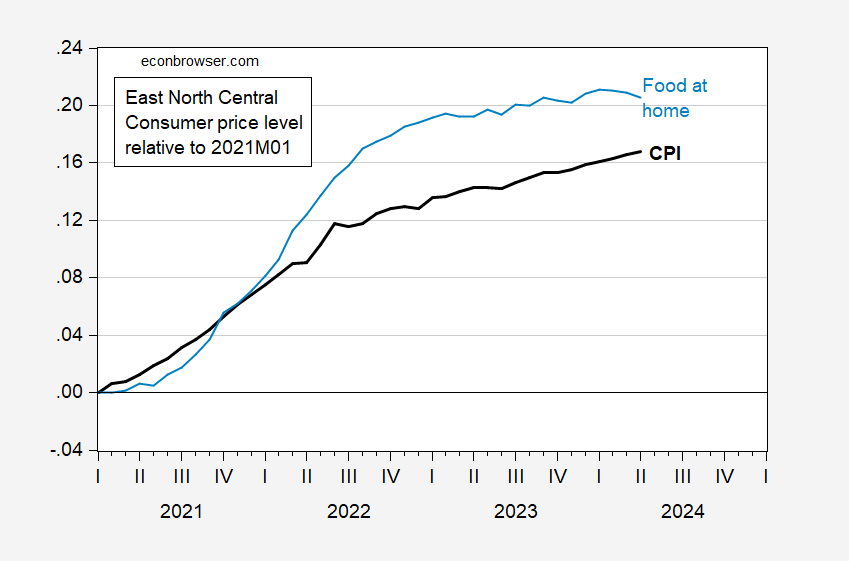
Figure 2: East North Central CPI (bold black), and East North Central food at home component (light blue), all in logs, 2021M01=0. Series seasonally adjusted by author using X-13 (log transform on level). Source: BLS, and author’s calculations.
However, because the subregion’s overall CPI has not risen as much as its national counterpart, the food-at-home/overall gap remains wider here.
More By This Author:
Manufacturing Over The Long TermCurrency Misalignment Measured Assuming A Balanced Financial Account
“Is the Boom-And-Bust Business Cycle Dead?”


Comments
Log in or sign up to join the conversation.