

Image Source: Pexels
The Bureau of Economic Analysis announced today that seasonally adjusted U.S. real GDP grew at a 4.3% annual rate in the third quarter. That is somewhat higher than both the historical average growth and the value anticipated by many forecasters.
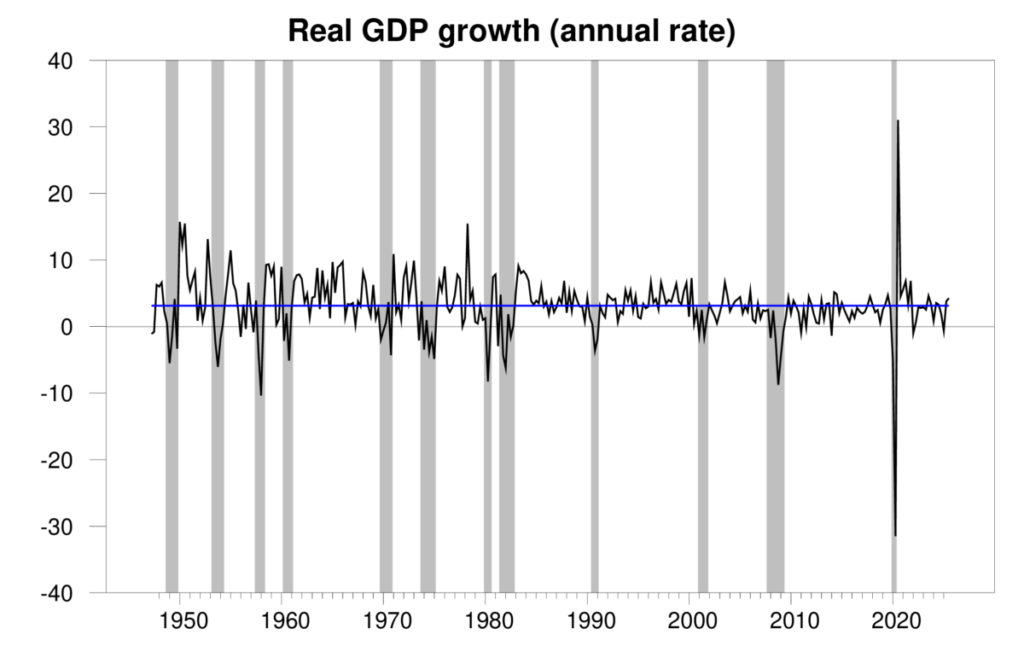
Quarterly real GDP growth at an annual rate, 1947:Q2-2025:Q3, with the historical average since 1947 (3.1%) in blue. Calculated as 400 times the difference in the natural log of real GDP from the previous quarter.
The new numbers bring the Econbrowser recession indicator index down to 2.7%, a historically very favorable level. One of the goals of this index is to provide a purely objective summary of the data using an algorithm that has been publicly used now for decades. The latest numbers put to rest the concern that a recession might have started earlier this year.
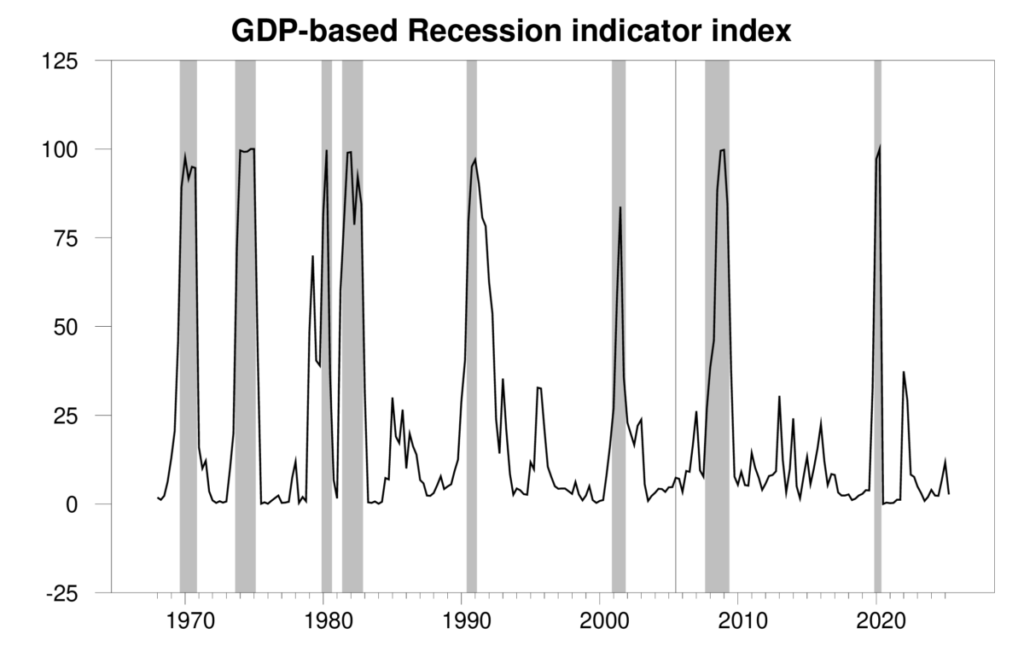
GDP-based recession indicator index. The plotted value for each date is based solely on the GDP numbers that were publicly available as of one quarter after the indicated date, with 2025:Q2 the last date shown on the graph. Shaded regions represent the NBER’s dates for recessions, which dates were not used in any way in constructing the index.
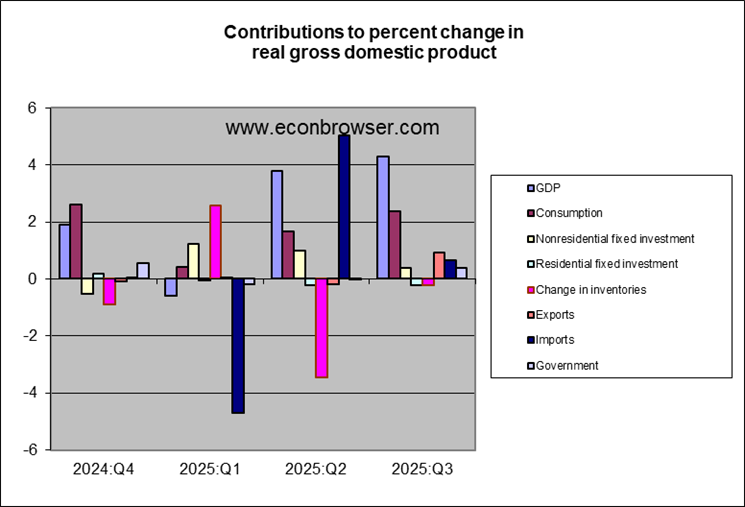
The details behind the GDP numbers are also encouraging. Net exports and nonresidential fixed investment offered a small boost to offset the continuing weak housing market.
According to the CPI, inflation hasn’t been looking that bad either.
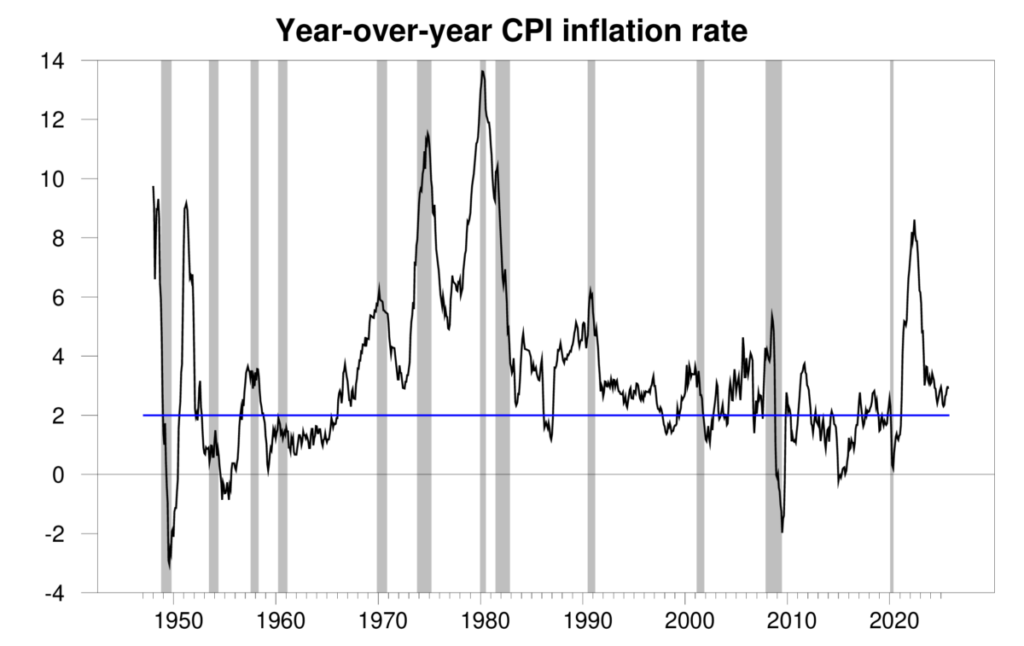
100 times the year-over-year change in the natural logarithm of the monthly CPI.
On the other hand, several indicators point to a weaker labor market. The two-year growth rate of the number of people working has definitely slowed down. I have suggested that a slowdown like this may often be an early indication that a recession is about to begin. But the current crackdown on foreign workers makes this measure harder to interpret than usual.
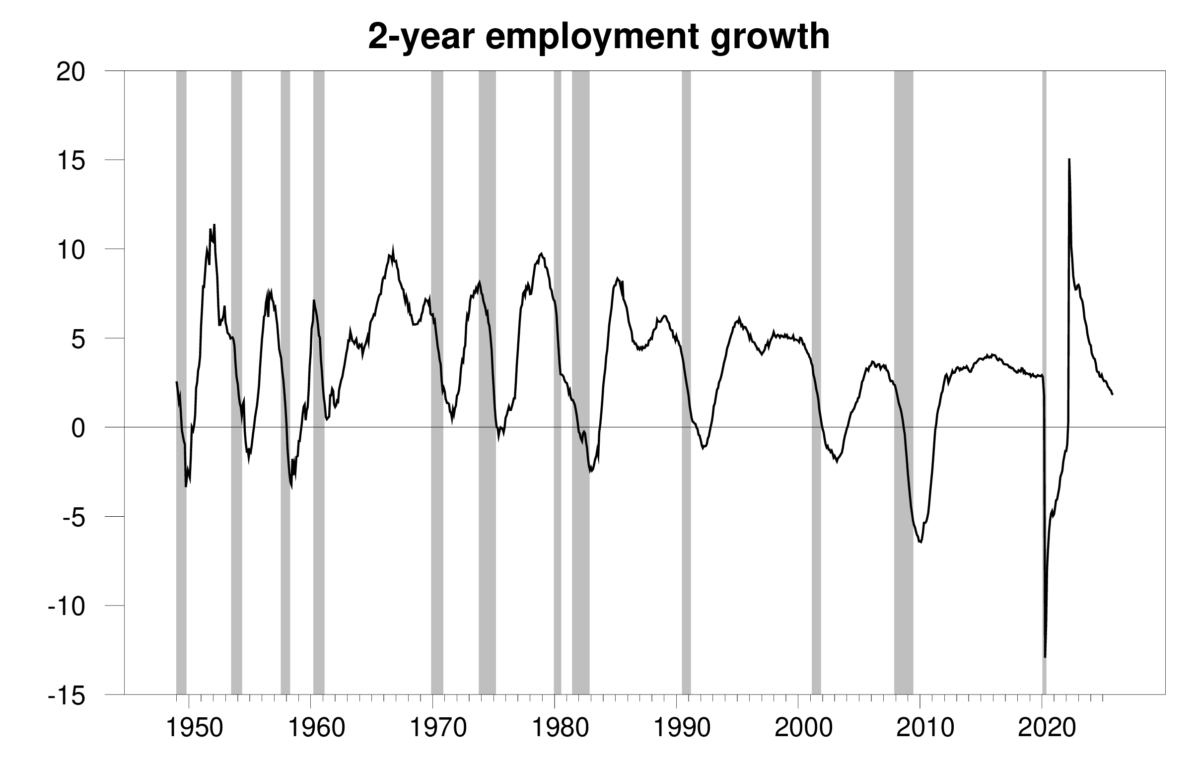
100 times the two-year change in the natural logarithm of monthly seasonally adjusted nonfarm payrolls, Jan 1949 to Dec 2025.
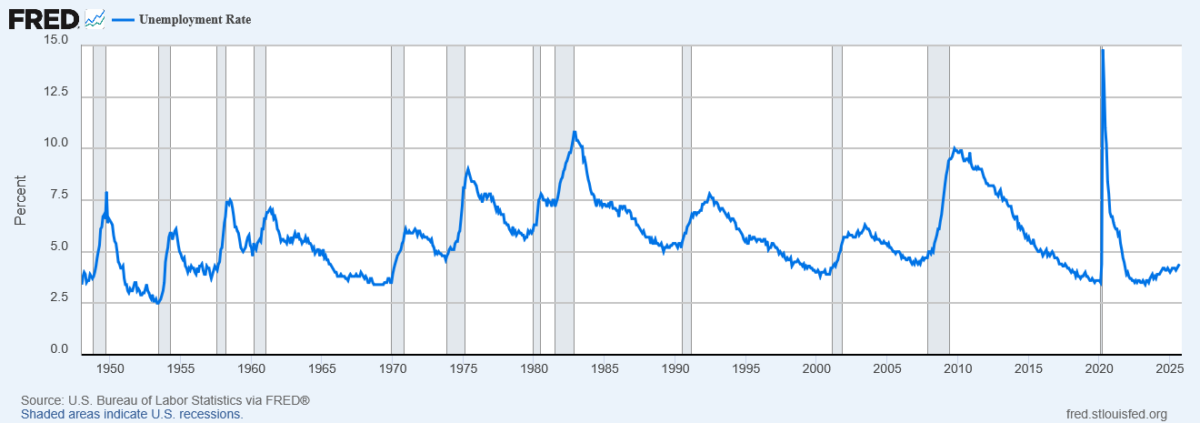
The unemployment rate ticked up to 4.6% in November. That’s still well below the historical average level of unemployment. Notwithstanding, Hall and Kudlyak argued that it’s unusual for the unemployment rate to be drifting up when the economy is still growing, as it appears recently to have been doing.
I regard initial claims for unemployment compensation as the single most reliable indicator of whether the labor situation has taken a sharp turn for the worse. Not everyone who is unemployed is eligible to receive compensation, and not everyone who is eligible applies for it. So when people apply, it provides a ground-level indication that they anticipate personal challenges ahead. According to this indicator, the labor market is still solid.
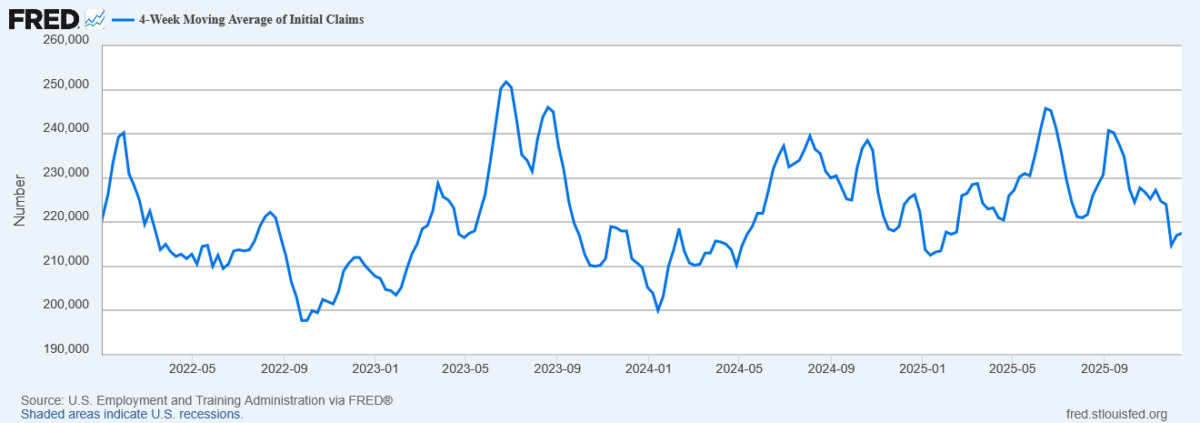
4-week average of initial claims, Jan 1, 2022 to Dec 13, 2025.
More By This Author:
Fed Governor/CEA Chair (On Leave) Miran: “Fed Risks Recession Without More Interest Rate Cuts”On The Eve Of The GDP Release: Forecasts, Nowcasts, Tracking
How’s Sector Employment Doing During This Promised Manufacturing “Golden Age”


Comments
Log in or sign up to join the conversation.