

Is Gold’s near-term correction completed? If so, it lasted 16 trading days spanning from the recent All-Time High of 2449 (12 April) down to 2285 (04 May), a loss of -164 points or -6.7%.
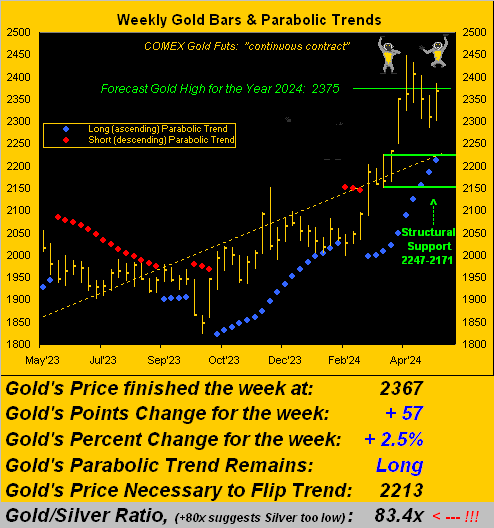
Moreover, renewed buying interest in Gold did not even let price reach down to test the 2247-2171 structural support zone, (which of course remains a viable consideration). But Gold buyers clearly came to the fore these past few days as COMEX contract volume recorded its fifth-most substantive week in well over a year, (indeed going back to that ending 20 March ’23).
So after two consecutive losing weeks, Gold scored a winner in settling yesterday (Friday) at 2367, its highest weekly close since that ending 19 April (then 2414), where upon we straightaway penned “Gold Fit to Pull Back a Bit” which it so did lickety-split. (That courtesy of the “We Hate It When We’re Right Dept.”)
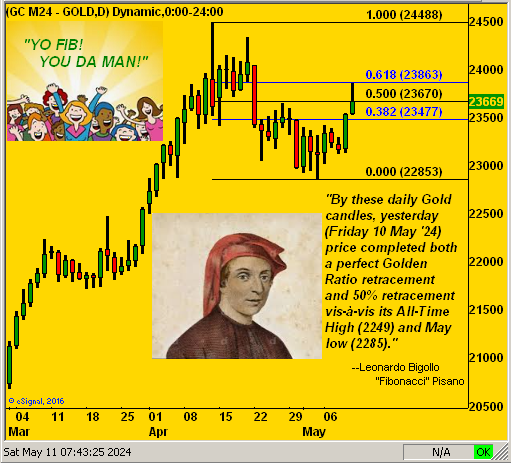
As for the entitled “…Groovy Golden Ratio Retracement”, ’twas quintessentially Fibonacci perfection for Gold on Friday. Now as you long-time advocates of The Gold Update know, hardly do we ever dwell upon nature’s pristine paragon of numerical sequencing as uncovered by Leonardo Bigollo “Fibonacci” Pisano away back into the turn of the 13th Century. Yet on occasion, that infamous 61.8% Golden Ratio as determined by The Fibster can elicit astonishing precision for markets’ price reversals.
Simple stated for those of you scoring at home, as noted, Gold’s All-Time High is 2449 and the low since then 2285. The 61.8% Golden Ratio retracement from that low back up toward the high is 2386: ’twas the precise high Gold reached on Friday before settling at the classic 50% retracement price of 2367. Perfection personified. To wit, look at the rightmost candle per this view of Gold’s daily bars from March-to-date, yesterday’s high at the 0.618 label and the close at the 0.500 label. A worthy tool to keep under your cash management hat:
‘
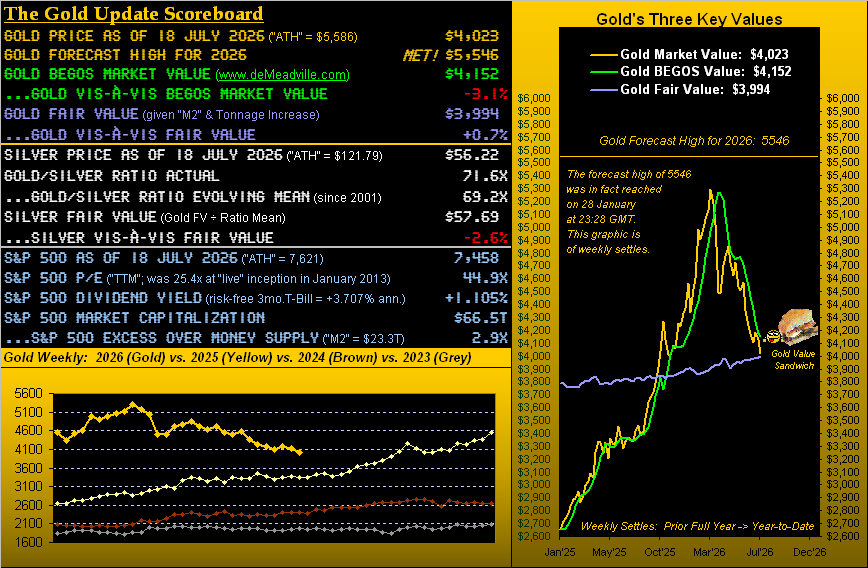
Course, the question then remains: has the near-term downside Gold correction run its course? Or is the perfect Fibonacci Golden Ratio retracement and subsequent same-day pullback signaling the resumption of such downside? To be sure, Gold’s daily “textbook technicals” (MACD, Price Oscillator, Moneyflow) — which a week ago were leaning lower — are just now bending up a bit. And yet per both the website’s Market Values and Gold pages, price is still +69 points above its smooth valuation line, (it has not been below same since 28 February). Also fundamentally, in a week almost completely bereft of incoming metrics for the Economic Barometer, save for some arguably “hawkish” FedSpeak to end said week, there’s really not that much upon which to critique. Yet as we all know, “the trend is your friend”, and as we next go to Gold’s weekly bars from a year ago-to-date, both the rising dashed linear regression trendline and blue-dotted parabolic Long trend look great. Warily however, prior to Gold next scoring a fresh All-Time High at 2450+, it may be a bit premature to start dancing to The Chipmunks ![]() “Funky Monkey“
“Funky Monkey“![]() :
:
Speaking of the Econ Baro, here ’tis by the day from one year ago-to-date along with the obscenely overvalued “Casino 500” (red line), the honestly-calculated “live” price/earnings ratio for which is now 39.1x and the yield 1.404% versus the U.S. Three-Month T-Bill’s annualized yield of 5.243%. But since fee-churning is everything to your investment banker, “Stocks are where it’s at, baby!” (Friendly reminder: lock-limit down for the S&P 500 futures is -7%, the last three such occurrences coming astride COVID back in March 2020):
Oooh, and guess to what word the financial community is finally awakening? “Stagflation”. Thus far in 2024, we first mentioned it ten missives ago on 02 March with “Gold Grabs Center-Stage as Stagflation Starts to Rage”. But in this age where no one does the math to be properly informed, it takes awhile for “stagflation” to get parroted up to the higher echelons of the FinMedia. To wit yesterday, (hat-tip Bloomy): “S&P 500 Runs Out of Steam Amid Stagflation Chatter.”
As for running out of steam (really?), the S&P has gained better than +4% in just the past seven trading sessions, (yes, it has again become “textbook overbought”). And with but a week to run in Earnings Season for Q1, growth hasn’t materially improved (which for you WestPalmBeachers down there means in this case hasn’t “lowered”) the aforementioned P/E of the S&P. “Stagflation” indeed: coming to an economic squeeze near you. Further, with 18 metrics due in the new week for the Econ Baro, we’ll know more on the staging of “stagflation”.
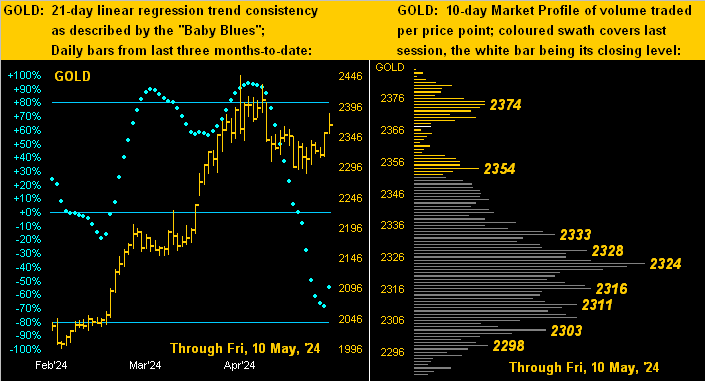
Clearly staging a rally into week’s end was Gold. To our two panel graphic we go featuring on the left Gold’s daily bars from three months ago-to-date and on the right price’s 10-day Market Profile. Note the sudden up-lurch in the “Baby Blues”, (and you know the drill: “Follow the Blues… else…”). Meanwhile by the Profile, Gold’s fattest volume support price is 2324:
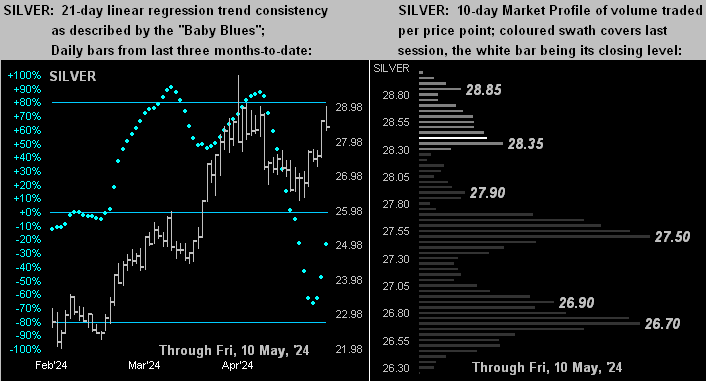
With the like graphic for Silver, her “Baby Blues” (at left) already have been lurching higher, with present price just tucked in there above the 28.35 Profile bar (at right). As earlier noted in the graphic of Gold’s weekly bars, the Gold/Silver ratio is now 83.4x versus the century-to-date average of 68.2x, i.e. Silver comparatively remains El Cheapo, (and Gold markedly so by currency debasement, in turn making Silver Super Cheapo). So don’t you be a Cheapo by forgetting Sister Silver!
Toward the wrap, let’s go to the stack:
The Gold Stack
Gold’s Value per Dollar Debasement, (from our opening “Scoreboard”): 3765
Gold’s All-Time Intra-Day High: 2449 (12 April 2024)
2024’s High: 2449 (12 April 2024)
Gold’s All-Time Closing High: 2391 (11 April 2024)
10-Session directional range: up to 2386 (from 2285) = +101 points or +4.4%
Trading Resistance: 2374
Gold Currently: 2367, (expected daily trading range [“EDTR”]: 37 points)
Trading Support: various from 2333 to 2298, most notably therein 2324
10-Session “volume-weighted” average price magnet: 2328
Structural Support: 2247-2171
The Weekly Parabolic Price to flip Short: 2213
The 2000’s Triple-Top: 2089 (07 Aug ’20); 2079 (08 Mar’22); 2085 (04 May ’23)
The 300-Day Moving Average: 2028 and rising
2024’s Low: 1996 (14 February)
The Gateway to 2000: 1900+
The Final Frontier: 1800-1900
The Northern Front: 1800-1750
On Maneuvers: 1750-1579
The Floor: 1579-1466
Le Sous-sol: Sub-1466
The Support Shelf: 1454-1434
Base Camp: 1377
The 1360s Double-Top: 1369 in Apr ’18 preceded by 1362 in Sep ’17
Neverland: The Whiny 1290s
The Box: 1280-1240
“So, we got your closer ready to go!“
And thank you, Squire, ’tis as rich as they come. We’ll spare (to benevolently save embarrassment) such pundit’s identity, but here we go. Ready? Hat-tip Dow Jones Newswires from last Monday:
- “Gold is overvalued now and won’t help you beat inflation in coming years.”
(Even the “doggy” can’t believe that one!)

Write it down and diarize to review, given ever-groovy Gold 3700+ is already overdue!
Cheers!
More By This Author:
Own Gold with Reason into Bank Failure SeasonGold Falters, Treads Water
Gold Reaps More Record Ground


Comments
Log in or sign up to join the conversation.