
Here are the latest charts and statistics for the Commitment of Traders (COT) data published by the Commodities Futures Trading Commission (CFTC).
The latest COT data is updated through Tuesday March 1st and shows a quick view of how large traders (for-profit speculators and commercial entities) were positioned in the futures markets.
Highlighting the COT energy data is this week’s jump in the WTI Crude Oil futures bets. The speculative net position in the WTI Crude Oil futures rose this week for the first time in the past six weeks and had the largest one-week gain of the past sixty-six weeks, dating back to November 24th of 2020. The WTI Crude contract had been seeing a weakness in speculator positions despite the ramping up of the Russia-Ukraine situation as spec positions had fallen for six straight weeks before this week’s turnaround. Crude oil prices have surged on the Russian invasion of Ukraine with oil closing this week right below the $116 per barrel level which marks the highest price close since 2008.
Joining WTI Crude Oil (29,622 contracts) in gaining this week were Brent Crude Oil (19,648 contracts) and Natural Gas (4,220 contracts) while Heating Oil (-9,228 contracts), Gasoline (-1,144 contracts) and the Bloomberg Commodity Index (-709 contracts) saw falling contracts.
Data Snapshot of Commodity Market Traders | Columns Legend
| WTI Crude | 2,028,476 | 25 | 368,663 | 14 | -410,955 | 79 | 42,292 | 75 |
| Corn | 1,484,670 | 18 | 460,938 | 89 | -427,812 | 11 | -33,126 | 24 |
| Natural Gas | 1,112,832 | 3 | -126,409 | 41 | 90,088 | 59 | 36,321 | 71 |
| Sugar | 816,211 | 0 | 84,539 | 54 | -105,323 | 48 | 20,784 | 34 |
| Soybeans | 758,796 | 35 | 218,907 | 84 | -189,233 | 21 | -29,674 | 21 |
| Gold | 615,600 | 51 | 257,622 | 70 | -285,809 | 30 | 28,187 | 44 |
| Wheat | 372,124 | 19 | 6,443 | 52 | 303 | 41 | -6,746 | 69 |
| Heating Oil | 349,618 | 31 | 6,455 | 52 | -32,434 | 37 | 25,979 | 88 |
| Coffee | 252,545 | 24 | 61,906 | 94 | -66,290 | 8 | 4,384 | 19 |
| Brent | 198,920 | 39 | -6,707 | 100 | 4,004 | 0 | 2,703 | 46 |
| Copper | 195,398 | 23 | 22,093 | 58 | -29,380 | 39 | 7,287 | 67 |
| Silver | 157,391 | 23 | 44,948 | 67 | -57,150 | 43 | 12,202 | 14 |
| Platinum | 65,383 | 31 | 16,890 | 26 | -24,196 | 74 | 7,306 | 64 |
| Palladium | 7,242 | 4 | -904 | 16 | 423 | 79 | 481 | 73 |
WTI Crude Oil Futures:
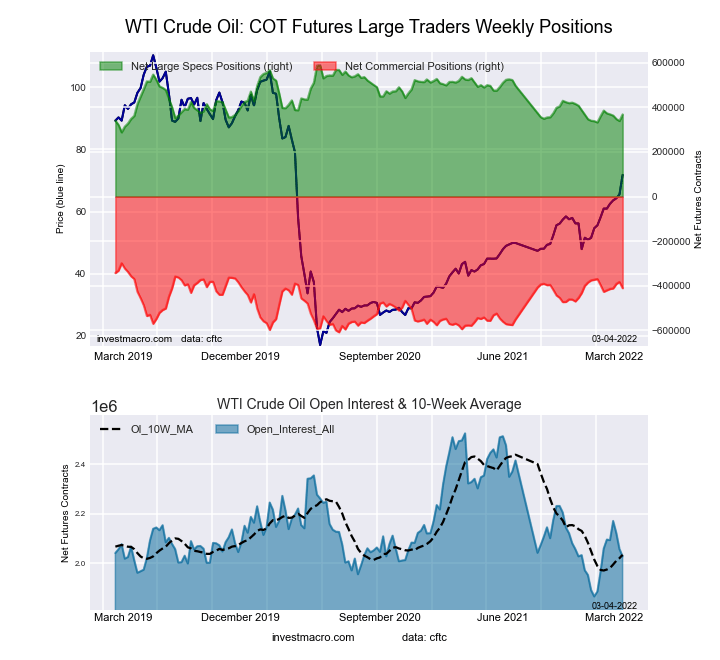
The WTI Crude Oil Futures large speculator standing this week was a net position of 368,663 contracts in the data reported through Tuesday. This was a weekly boost of 29,622 contracts from the previous week which had a total of 339,041 net contracts.
This week’s current strength score (the trader positioning range over the past three years, measured from 0 to 100) shows the speculators are currently Bearish-Extreme with a score of 14.0 percent. The commercials are Bullish with a score of 79.1 percent and the small traders (not shown in chart) are Bullish with a score of 74.6 percent.
| WTI Crude Oil Futures Statistics | SPECULATORS | COMMERCIALS | SMALL TRADERS |
| – Percent of Open Interest Longs: | 22.9 | 36.0 | 4.9 |
| – Percent of Open Interest Shorts: | 4.8 | 56.2 | 2.8 |
| – Net Position: | 368,663 | -410,955 | 42,292 |
| – Gross Longs: | 465,365 | 729,585 | 99,568 |
| – Gross Shorts: | 96,702 | 1,140,540 | 57,276 |
| – Long to Short Ratio: | 4.8 to 1 | 0.6 to 1 | 1.7 to 1 |
| NET POSITION TREND: | |||
| – Strength Index Score (3 Year Range Pct): | 14.0 | 79.1 | 74.6 |
| – Strength Index Reading (3 Year Range): | Bearish-Extreme | Bullish | Bullish |
| NET POSITION MOVEMENT INDEX: | |||
| – 6-Week Change in Strength Index: | -6.7 | 6.4 | 1.4 |
Brent Crude Oil Futures:
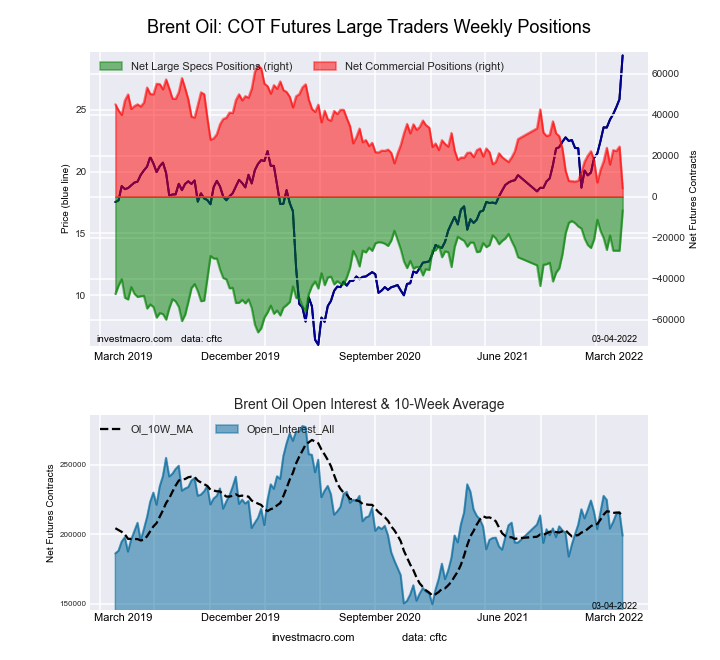
The Brent Crude Oil Futures large speculator standing this week was a net position of -6,707 contracts in the data reported through Tuesday. This was a weekly rise of 19,648 contracts from the previous week which had a total of -26,355 net contracts.
This week’s current strength score (the trader positioning range over the past three years, measured from 0 to 100) shows the speculators are currently Bullish-Extreme with a score of 100.0 percent. The commercials are Bearish-Extreme with a score of 0.0 percent and the small traders (not shown in chart) are Bearish with a score of 45.8 percent.
| Brent Crude Oil Futures Statistics | SPECULATORS | COMMERCIALS | SMALL TRADERS |
| – Percent of Open Interest Longs: | 23.1 | 40.9 | 4.2 |
| – Percent of Open Interest Shorts: | 26.5 | 38.9 | 2.9 |
| – Net Position: | -6,707 | 4,004 | 2,703 |
| – Gross Longs: | 45,940 | 81,376 | 8,390 |
| – Gross Shorts: | 52,647 | 77,372 | 5,687 |
| – Long to Short Ratio: | 0.9 to 1 | 1.1 to 1 | 1.5 to 1 |
| NET POSITION TREND: | |||
| – Strength Index Score (3 Year Range Pct): | 100.0 | 0.0 | 45.8 |
| – Strength Index Reading (3 Year Range): | Bullish-Extreme | Bearish-Extreme | Bearish |
| NET POSITION MOVEMENT INDEX: | |||
| – 6-Week Change in Strength Index: | 22.7 | -21.9 | -4.0 |
Natural Gas Futures:
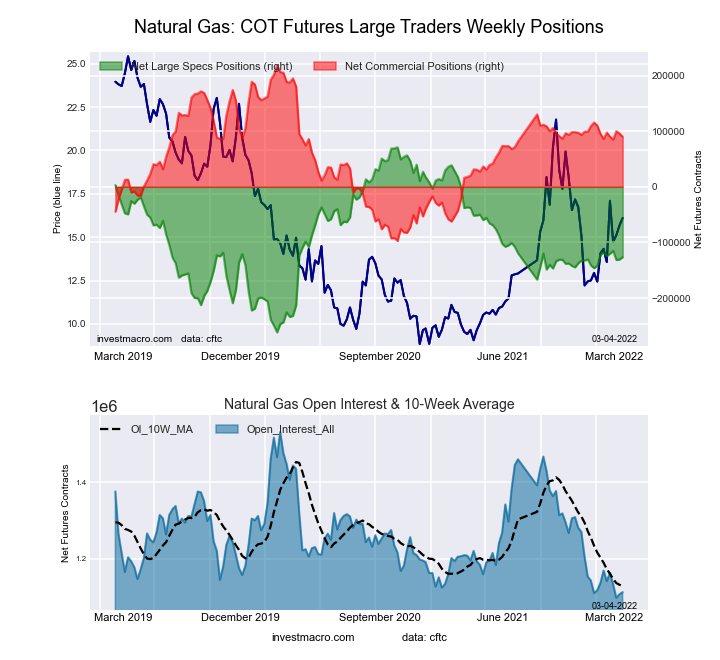
The Natural Gas Futures large speculator standing this week was a net position of -126,409 contracts in the data reported through Tuesday. This was a weekly rise of 4,220 contracts from the previous week which had a total of -130,629 net contracts.
This week’s current strength score (the trader positioning range over the past three years, measured from 0 to 100) shows the speculators are currently Bearish with a score of 40.6 percent. The commercials are Bullish with a score of 59.3 percent and the small traders (not shown in chart) are Bullish with a score of 70.9 percent.
| Natural Gas Futures Statistics | SPECULATORS | COMMERCIALS | SMALL TRADERS |
| – Percent of Open Interest Longs: | 22.1 | 43.6 | 5.3 |
| – Percent of Open Interest Shorts: | 33.4 | 35.5 | 2.1 |
| – Net Position: | -126,409 | 90,088 | 36,321 |
| – Gross Longs: | 245,502 | 484,644 | 59,416 |
| – Gross Shorts: | 371,911 | 394,556 | 23,095 |
| – Long to Short Ratio: | 0.7 to 1 | 1.2 to 1 | 2.6 to 1 |
| NET POSITION TREND: | |||
| – Strength Index Score (3 Year Range Pct): | 40.6 | 59.3 | 70.9 |
| – Strength Index Reading (3 Year Range): | Bearish | Bullish | Bullish |
| NET POSITION MOVEMENT INDEX: | |||
| – 6-Week Change in Strength Index: | -2.5 | 1.2 | 11.2 |
Gasoline Blendstock Futures:
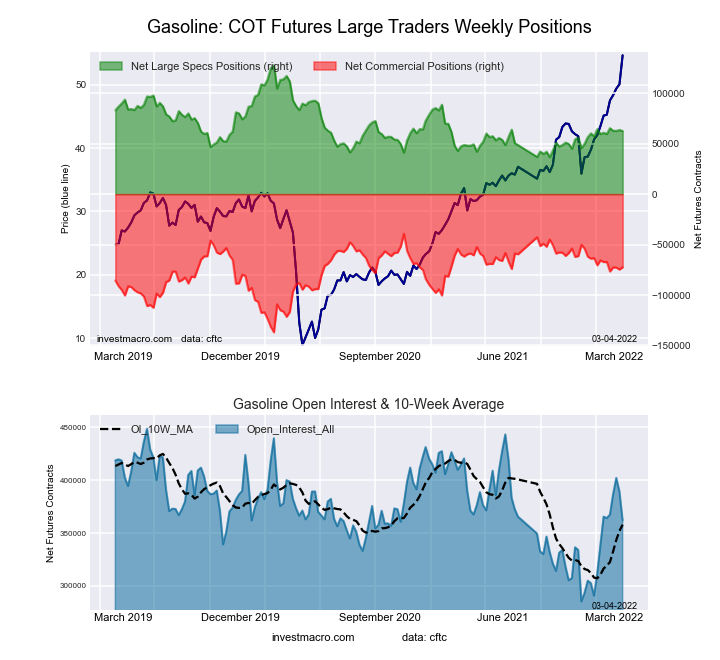
The Gasoline Blendstock Futures large speculator standing this week was a net position of 62,443 contracts in the data reported through Tuesday. This was a weekly lowering of -1,144 contracts from the previous week which had a total of 63,587 net contracts.
This week’s current strength score (the trader positioning range over the past three years, measured from 0 to 100) shows the speculators are currently Bearish with a score of 33.6 percent. The commercials are Bullish with a score of 64.5 percent and the small traders (not shown in chart) are Bullish with a score of 71.4 percent.
| Nasdaq Mini Futures Statistics | SPECULATORS | COMMERCIALS | SMALL TRADERS |
| – Percent of Open Interest Longs: | 26.8 | 50.4 | 6.3 |
| – Percent of Open Interest Shorts: | 9.6 | 70.4 | 3.6 |
| – Net Position: | 62,443 | -72,465 | 10,022 |
| – Gross Longs: | 97,185 | 182,352 | 22,896 |
| – Gross Shorts: | 34,742 | 254,817 | 12,874 |
| – Long to Short Ratio: | 2.8 to 1 | 0.7 to 1 | 1.8 to 1 |
| NET POSITION TREND: | |||
| – Strength Index Score (3 Year Range Pct): | 33.6 | 64.5 | 71.4 |
| – Strength Index Reading (3 Year Range): | Bearish | Bullish | Bullish |
| NET POSITION MOVEMENT INDEX: | |||
| – 6-Week Change in Strength Index: | 1.7 | -5.2 | 21.2 |
#2 Heating Oil NY-Harbor Futures:
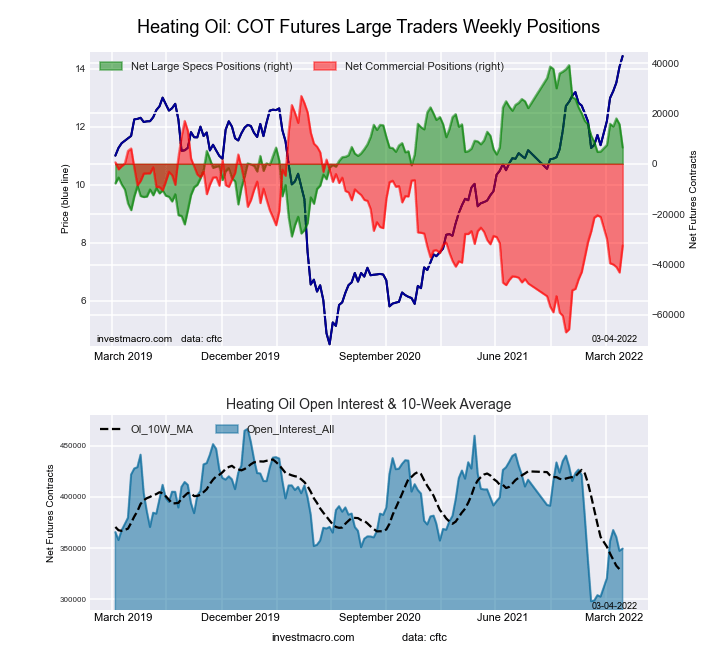
The #2 Heating Oil NY-Harbor Futures large speculator standing this week was a net position of 6,455 contracts in the data reported through Tuesday. This was a weekly reduction of -9,228 contracts from the previous week which had a total of 15,683 net contracts.
This week’s current strength score (the trader positioning range over the past three years, measured from 0 to 100) shows the speculators are currently Bullish with a score of 51.9 percent. The commercials are Bearish with a score of 36.7 percent and the small traders (not shown in chart) are Bullish-Extreme with a score of 88.4 percent.
| Heating Oil Futures Statistics | SPECULATORS | COMMERCIALS | SMALL TRADERS |
| – Percent of Open Interest Longs: | 17.0 | 50.8 | 14.4 |
| – Percent of Open Interest Shorts: | 15.1 | 60.1 | 6.9 |
| – Net Position: | 6,455 | -32,434 | 25,979 |
| – Gross Longs: | 59,340 | 177,626 | 50,210 |
| – Gross Shorts: | 52,885 | 210,060 | 24,231 |
| – Long to Short Ratio: | 1.1 to 1 | 0.8 to 1 | 2.1 to 1 |
| NET POSITION TREND: | |||
| – Strength Index Score (3 Year Range Pct): | 51.9 | 36.7 | 88.4 |
| – Strength Index Reading (3 Year Range): | Bullish | Bearish | Bullish-Extreme |
| NET POSITION MOVEMENT INDEX: | |||
| – 6-Week Change in Strength Index: | 4.2 | -10.3 | 23.6 |
Bloomberg Commodity Index Futures:
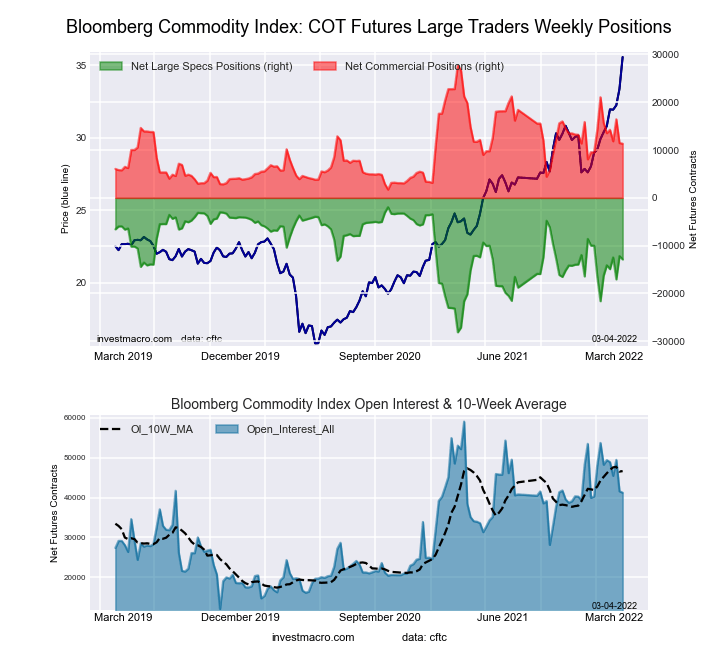
The Bloomberg Commodity Index Futures large speculator standing this week was a net position of -12,876 contracts in the data reported through Tuesday. This was a weekly lowering of -709 contracts from the previous week which had a total of -12,167 net contracts.
This week’s current strength score (the trader positioning range over the past three years, measured from 0 to 100) shows the speculators are currently Bullish with a score of 58.2 percent. The commercials are Bearish with a score of 36.9 percent and the small traders (not shown in chart) are Bullish with a score of 73.8 percent.
| Bloomberg Index Futures Statistics | SPECULATORS | COMMERCIALS | SMALL TRADERS |
| – Percent of Open Interest Longs: | 63.4 | 29.1 | 3.9 |
| – Percent of Open Interest Shorts: | 94.6 | 1.6 | 0.2 |
| – Net Position: | -12,876 | 11,345 | 1,531 |
| – Gross Longs: | 26,144 | 12,001 | 1,605 |
| – Gross Shorts: | 39,020 | 656 | 74 |
| – Long to Short Ratio: | 0.7 to 1 | 18.3 to 1 | 21.7 to 1 |
| NET POSITION TREND: | |||
| – Strength Index Score (3 Year Range Pct): | 58.2 | 36.9 | 73.8 |
| – Strength Index Reading (3 Year Range): | Bullish | Bearish | Bullish |
| NET POSITION MOVEMENT INDEX: | |||
| – 6-Week Change in Strength Index: | 13.0 | -16.8 | 34.1 |
*COT Report: The COT data, released weekly to the public each Friday, is updated through the most recent Tuesday (data is 3 days old) and shows a quick view of how large speculators or non-commercials (for-profit traders) were positioned in the futures markets.
The CFTC categorizes trader positions according to commercial hedgers (traders who use futures contracts for hedging as part of the business), non-commercials (large traders who speculate to realize trading profits) and nonreportable traders (usually small traders/speculators) as well as their open interest (contracts open in the market at time of reporting).See CFTC criteria here.


Comments
Log in or sign up to join the conversation.