Weekly Forex Forecast – Nasdaq 100 Index, EUR/USD, GBP/USD, USD/CHF
The difference between success and failure in Forex / CFD trading is highly likely to depend mostly upon which assets you choose to trade each week and in which direction, and not on the exact methods you might use to determine trade entries and exits.
So, when starting the week, it is a good idea to look at the big picture of what is developing in the market as a whole, and how such developments and affected by macro fundamentals, technical factors, and market sentiment. There are several valid long-term trends in the market right now, which might be exploited profitably. Read on to get my weekly analysis below.
Fundamental Analysis & Market Sentiment
I wrote in my previous piece on 16th April that the best trade opportunities for the week were likely to be:
- Long Bitcoin against the USD following a bullish reversal on the H4 time frame above $30,000. This did not set up.
- Long of the EUR/USD currency pair following a bullish reversal on the H4 time frame. This would have produced about 60 pips of profit (0.55%).
- Long of the Nasdaq 100 Index. The Index closed 0.83% lower over the week.
- Long of Gold following a bullish rejection of $1950, or $1917. This did not set up.
- Long of Silver following a bullish reversal on the H4 time frame. This produced a loss of 1.18%.
My forecast produced an overall loss of 1.46%, averaging -0.29%.
News about global financial markets is currently a bit thin, with not much going on. Probably the major focus is the US Federal Reserve’s next meeting in May amid the expectation the Fed will make its final rate hike of 0.25% in the current cycle.
The most important data released last week concerned CPI (inflation) in the UK, Canada, and New Zealand, following US inflation’s strong fall the previous week. The data showed stronger-than-expected declines in Australia and New Zealand, but in the UK, annualized inflation surprisingly stayed above 10%.
Last week’s other key data releases were:
- US Unemployment Claims – this came in approximately as expected.
- Flash Services & Manufacturing PMI for USA, Germany, France, and UK – services data beat expectations while manufacturing data mostly underperformed.
- US Empire State Manufacturing Index – this came in better than expected.
- UK Claiming Count Change (unemployment) – this came in worse than expected.
The Week Ahead: April 24-28
The coming week in the markets is likely to see a higher level of volatility thank last week, due to a higher intensity of key data releases scheduled. This week’s key data releases are, in order of importance:
- US Core PCE Price Index data
- US Advance GDP data
- German Preliminary CPI
- Bank of Japan Outlook Report and Monetary Policy Statement
- Australian CPI (inflation) data
- US CB Consumer Confidence data
- Canadian GDP data
- US Unemployment Claims data
- US Employment Cost Index
Tuesday will be a public holiday in Italy, Australia, and New Zealand.
Technical Analysis
US Dollar Index
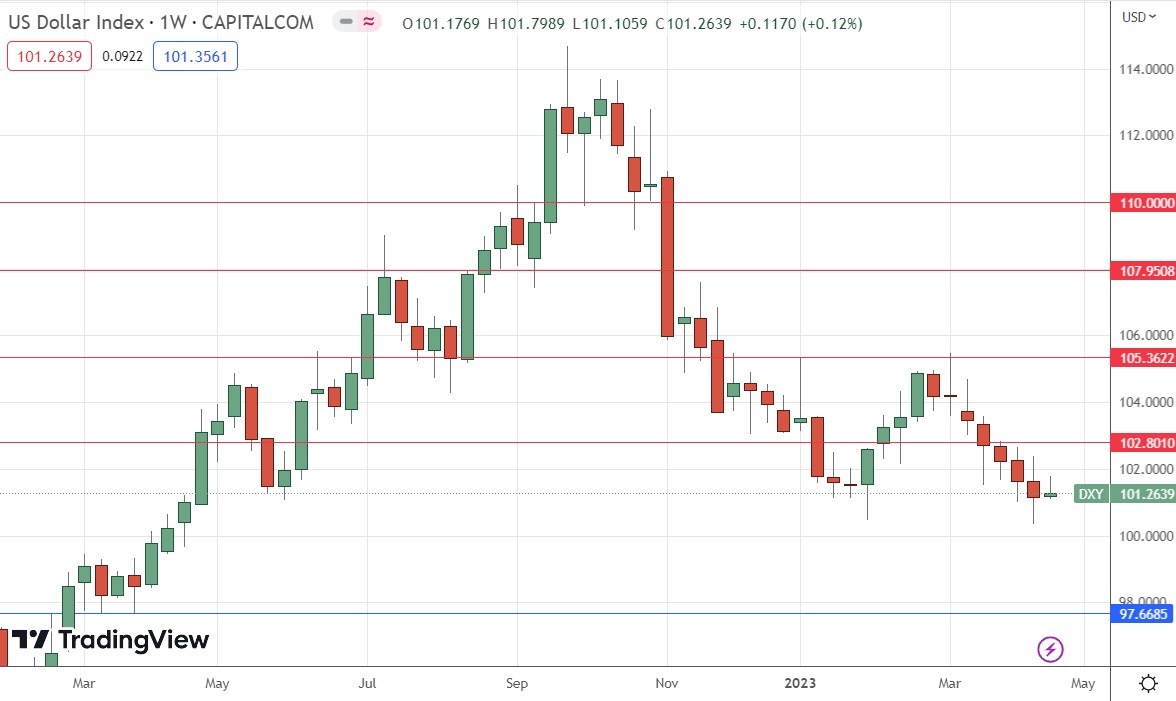
The weekly price chart below shows the U.S. Dollar Index was practically unchanged over the past week, with the week’s volatility the lowest seen since the last week of January earlier this year.
The weekly candlestick is almost a bearish pin bar, as well as being an inside bar. This typically signifies continuation and here we see a dominant bearish trend.
This suggests that we may be likely to see a fall in the value of the US Dollar over the coming week, which is reinforced by the long-term bearish trend in which the Dollar is trading below its levels of both 3 and 6 months ago.
Nasdaq 100 Index
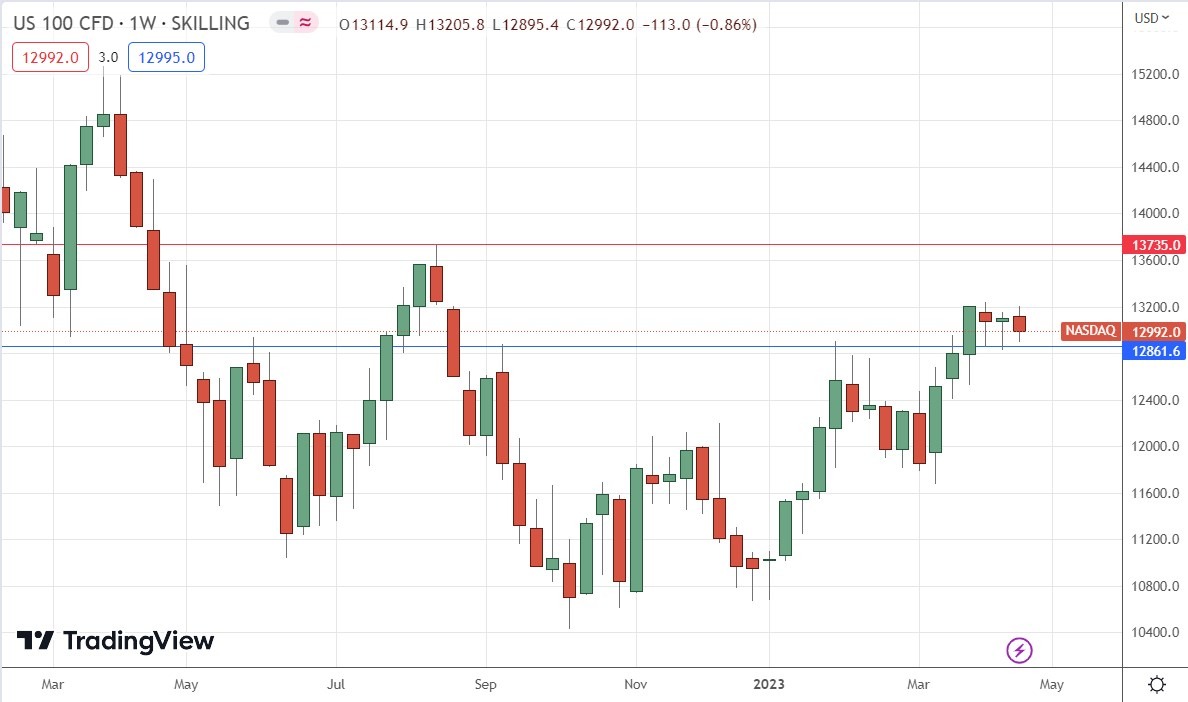
We saw a decline in the Nasdaq 100 Index over the past week. However, in the context of the wider price action, the technical picture here remains bullish, as the support level I identified at 12861.6 is continuing to hold up.
There are no key resistance levels until 13735, so the price has room to rise.
The Nasdaq 100 Index still looks like a buy, but bulls should be warned some major industry players are talking down the recent tech rally. It may be the case that we will not see a firm bullish move here until after the Fed’s next meeting in May, which bulls will hope confirms the end of the current rate hike cycle.
I remain bullish here as long as we do not see a daily close below the support level at 12861.6.
EUR/USD
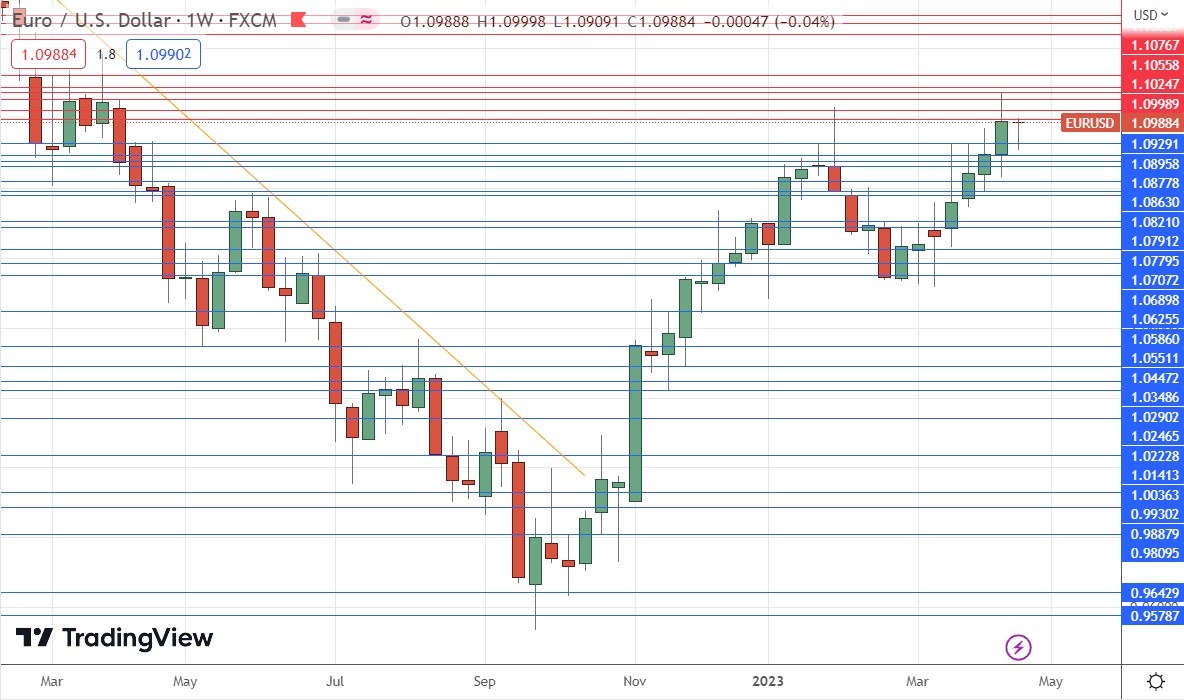
The EUR/USD currency pair printed a bullish inside pin bar to end the week approximately unchanged.
Another bullish sign is that the weekly candlestick rejected the key support level at $1.0929.
The bullish case is a bit weakened by the strong cluster of resistance levels between $1.1000 and $1.1100, which seem to be holding strong.
Much will likely depend upon German CPI data due this week, as well as whether the bearish trend in the US Dollar continues.
GBP/USD
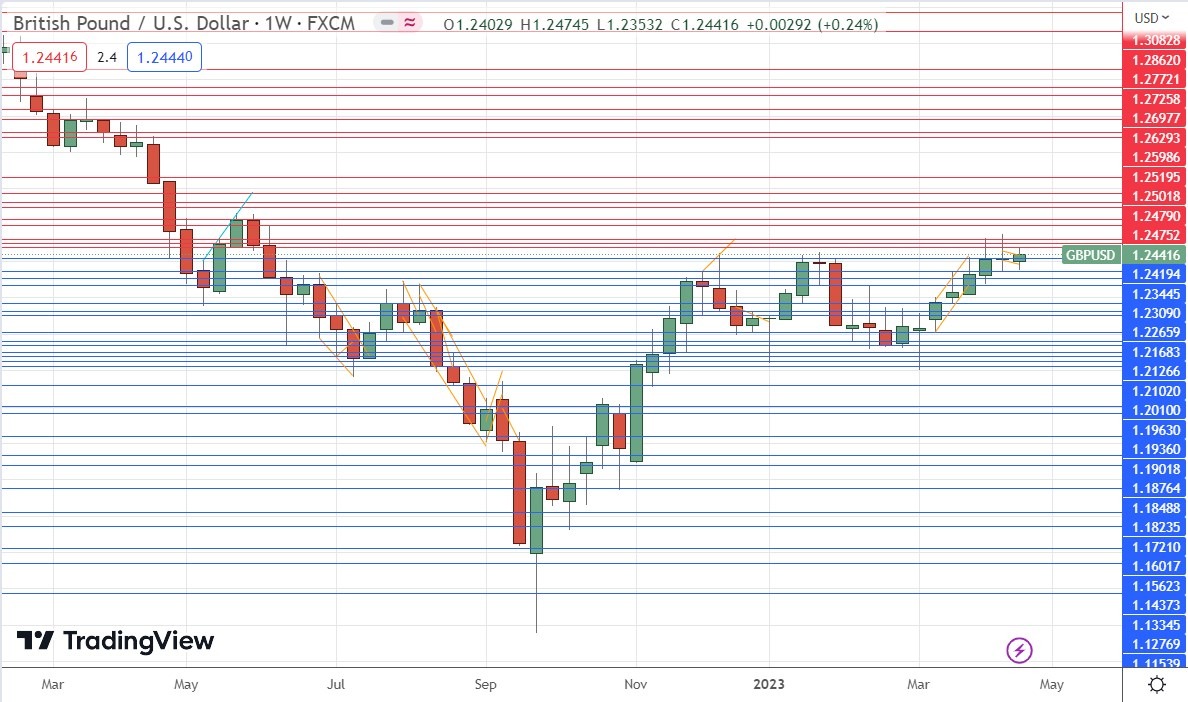
The GBP/USD currency pair rose to make a 10-month high weekly close, but the weekly candlestick was small.
Another bullish sign is that the weekly candlestick is an inside bar within a long-term bullish trend.
The long-term bullish trend clearly remains valid, although momentum has slowed down. We see the price trading above its levels of both 3 and 6 months ago.
The British Pound is one of the stronger major currencies, despite UK inflation remaining persistently high above 10%, so if the US Dollar’s bearish trend resumes this coming week, we can expect to see higher prices in this currency pair.
USD/CHF
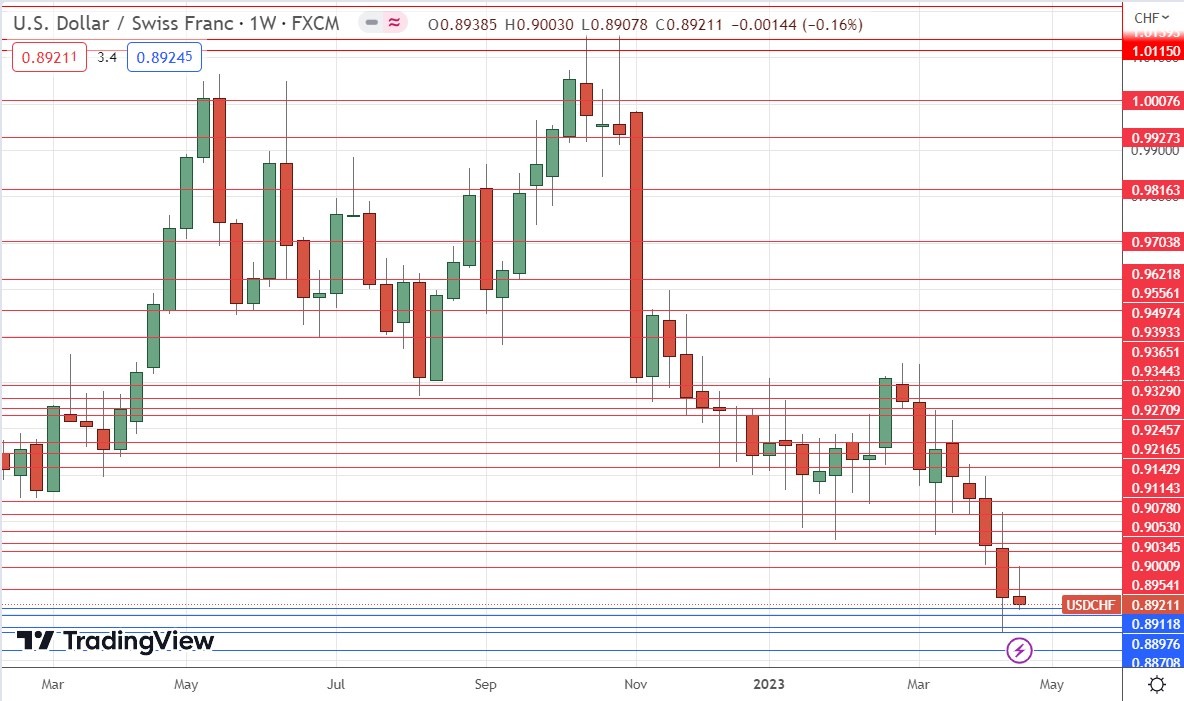
The USD/CHF currency pair fell again last week for the fifth consecutive week, printing a bearish inside bar which was also a pin bar.
Although this currency pair hates to trend historically, we are seeing persistent strength in this Swiss Franc. The Swissie seems to have regained its status as a safe-haven currency at the expense of the volatile Japanese Yen in recent weeks.
The week before last saw the price reach a new 2-year low before it rebounded.
I see the problem for bears, who have all the conditions on their side, as only lying in the cluster of support levels above $0.8840. I think that if we get a daily close below that level, we could see a faster and more significant fall.
Bottom Line
I see the best trading opportunities this week as:
- Long of the EUR/USD currency pair following a bullish reversal on the H4 time frame rejecting $1.0929.
- Long of the Nasdaq 100 Index.
- Long of the GBP/USD currency pair following a daily close above $1.2500.
- Short of the USD/CHF currency pair following a daily close below $0.8840.
More By This Author:
GBP/USD Technical Analysis Formation Of Descending Channel
BTC/USD Forex Signal: Consolidates But More Gains Possible
GBP/USD: Weekly Forecast 16th April - 22th April
Disclosure: DailyForex will not be held liable for any loss or damage resulting from reliance on the information contained within this website including market news, analysis, trading signals ...
more


