BTC/USD Forex Signal: Consolidates But More Gains Possible
Bullish view
- Buy the BTC/USD pair and set a take-profit at 32,000.
- Add a stop-loss at 29,200.
- Timeline: 1-2 days.

Bearish view
- Set a sell-stop at 29,500 and a take-profit at 28,500.
- Add a stop-loss at 32,000.
The BTC/USD price moved sideways at its highest point since June last year as traders reflected on the recent economic events and the upcoming regional bank earnings. The pair was trading at ~30,000 on Monday morning, which was 96% above the lowest point in 2022, making it one of the best-performing assets in the industry.
Fed pivoting hopes
Bitcoin price has soared recently as hopes of the Federal Reserve will start pivoting soon. This is after recent economic data showed that the American economy was slowing. Early this month, data showed that the number of vacancies in the US dropped below 10 million for the first time since 2021. Additional numbers revealed that wage growth continued to slow down in March.
Last week, the US published encouraging consumer and producer inflation data. According to the statistics agency, the headline inflation dropped to 5.0%, the lowest level since 2021. It has dropped in the past several straight months. US retail sales numbers disappointed in March.
Meanwhile, minutes of the Federal Reserve showed that some members of the committee wanted to pause rate hikes in March. The Fed also warned that the US will likely go through a mild recession this year as regional banks slow their lending.
Therefore, there is a possibility that the Federal Reserve will start pausing in the coming months. If this happens, the Fed will be following other central banks like the RBA, RBI, and the BoC that have paused their interest rate hikes. Such a move will be positive for risky assets like stocks and cryptocurrencies.
The BTC/USD pair has also dropped because of the falling US dollar. The dollar index has plunged by almost 15% from its highest point in 2022 and there is a possibility it will drop below the $100 support level.
BTC/USD technical analysis
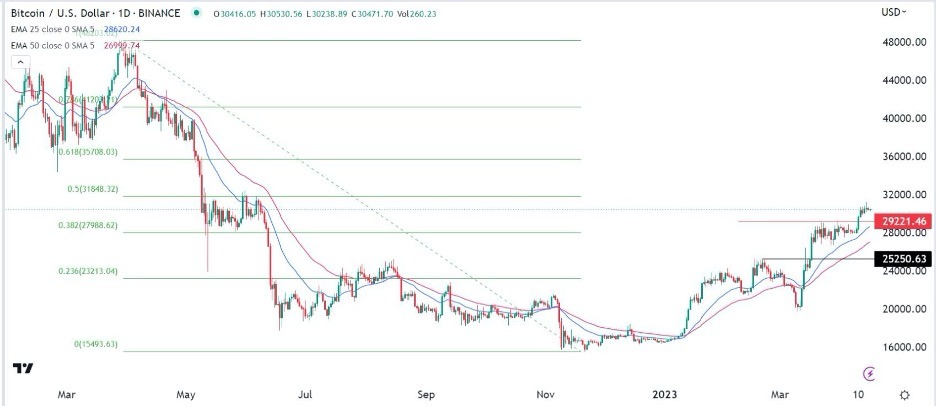
The daily chart shows that the BTC/USD pair has been in a bullish trend in the past few days. It has moved above the key resistance points at 25,250 and 29,221, the highest points on February 23 and March 25. The pair has moved above the 50-day moving average and the 38.2% Fibonacci Retracement level. It has also formed an inverted head and shoulders pattern.
Therefore, the pair will likely continue rising as buyers target the key resistance point at 32,000. The stop-loss of this trade is 29,220.

More By This Author:
GBP/USD: Weekly Forecast 16th April - 22th AprilTrading Support And Resistance - Sunday, April 16
EUR/USD: Weekly Forecast April 16 - 22
Disclosure: DailyForex will not be held liable for any loss or damage resulting from reliance on the information contained within this website including market news, analysis, trading signals ...
more


