

USD/JPY appears to be tracking the rise in US Treasury yields as it rallies for four consecutive days, with the exchange rate on the cusp of testing the yearly high (145.90) as it extends the series of higher highs and lows from last week.
As a result, USD/JPY may continue to appreciate ahead of the update to the US Consumer Price Index (CPI) as it seems to be tracking the positive slope in the 50-Day SMA (140.02), and signs of sticky inflation may generate a bullish reaction in the Dollar as it puts pressure on the Federal Reserve to pursue a highly restrictive policy.
(Click on image to enlarge)
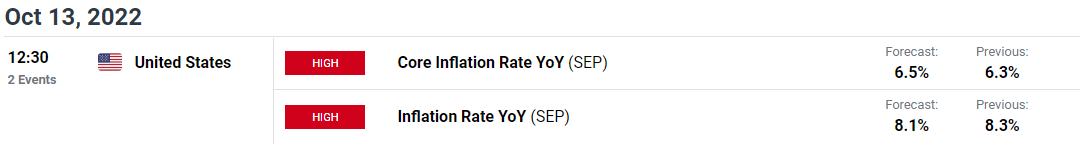
Another uptick in the core CPI may keep USD/JPY afloat as the reading is expected to increase to 6.5% in September from 6.3% per annum the month prior, and the development may force the Federal Open Market Committee (FOMC) to retain its approach in combating inflation as the Summary of Economic Projections (SEP) reflect a steeper path for US interest rates.
In turn, the US Dollar may continue to outperform against its Japanese counterpart even though Japan intervenes in foreign exchange markets for the first time since 1998, and the tilt in retail sentiment looks poised to persist ahead of the next Fed interest rate decision on November 2 as traders have been net-short USD/JPY for most of the year.
(Click on image to enlarge)
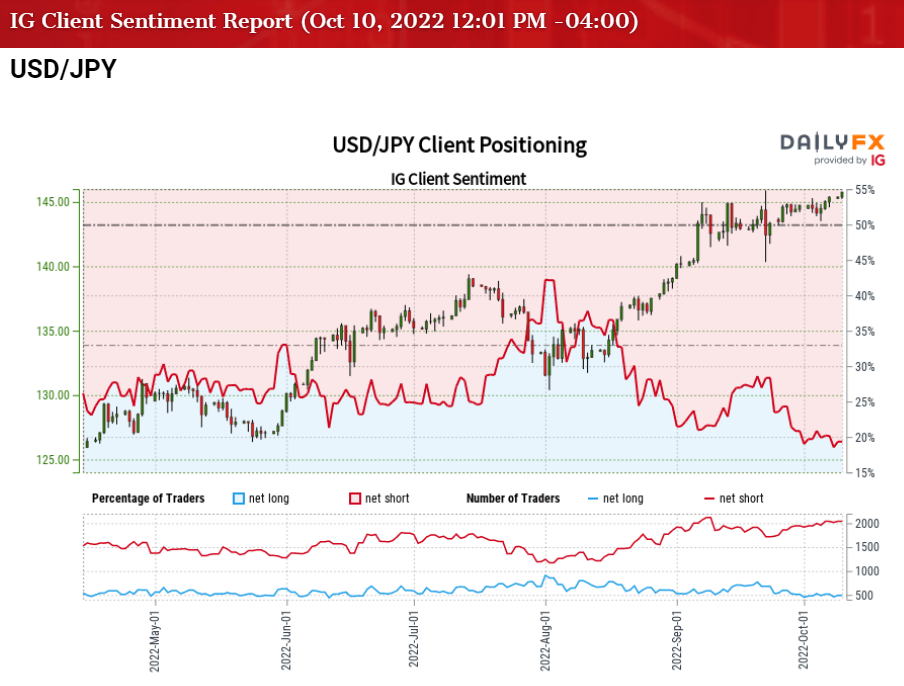
The IG Client Sentiment report shows only 21.49% of traders are currently net-long USD/JPY, with the ratio of traders short to long standing at 3.65 to 1.
The number of traders net-long is 12.52% higher than yesterday and 0.69% lower from last week, while the number of traders net-short is 2.04% higher than yesterday and 7.69% higher from last week. the marginal decline in net-long position comes as USD/JPY approaches the yearly high (145.90), while the rise in net-short interest has fueled the crowding behavior as 24.32% of traders were net-long the pair during the last week of September.
With that said, USD/JPY may continue to appreciate ahead of the US CPI report as it extends the series of higher highs and lows from last week, and a move above 70 in the Relative Strength Index (RSI) is likely to be accompanied by a further appreciation in the exchange rate like the price action from last month.
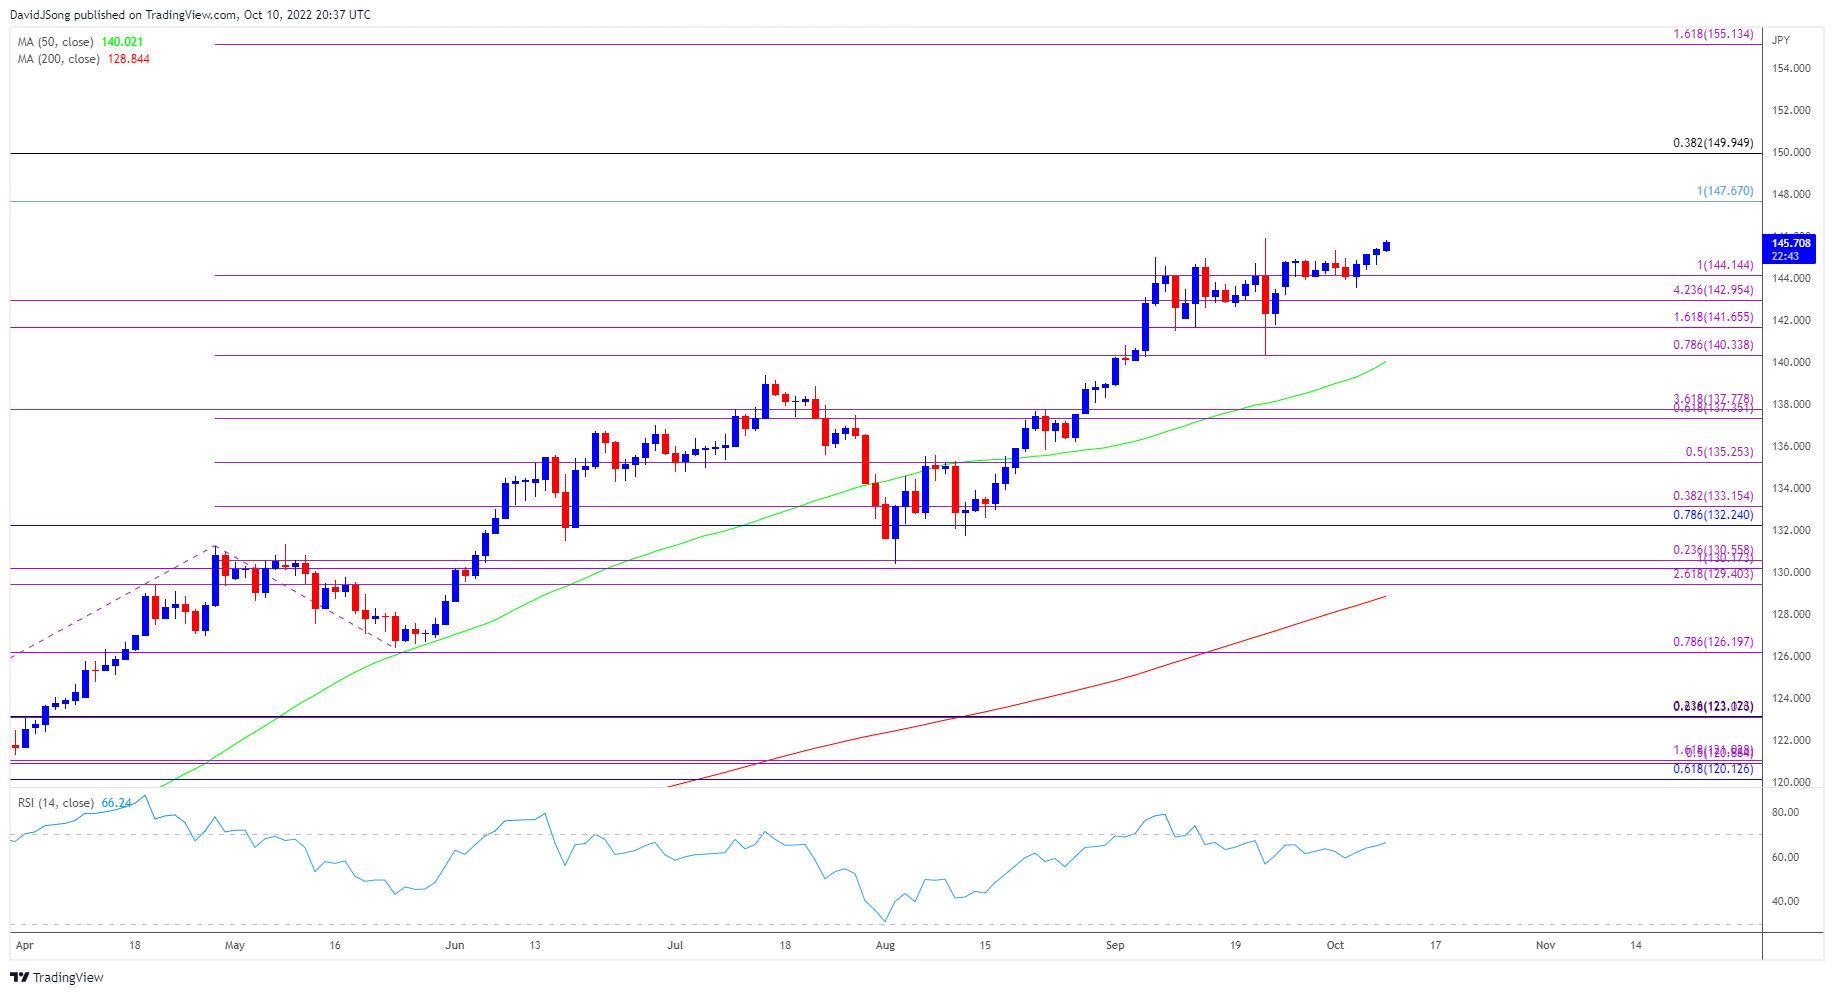
USD/JPY Rate Daily Chart
(Click on image to enlarge)
Source: Trading View
- USD/JPY is on the cusp of testing the September high (145.90) as it clears the monthly opening range, with the four-day rally in the exchange rate pushing the Relative Strength Index (RSI) towards overbought territory.
- A move above 70 in the Relative Strength Index (RSI) is likely to be accompanied by a further appreciation in USD/JPY like the price action from last month, with the recent series of higher highs and lows raising the scope for another run at the August 1998 high (147.67).
- Next area of interest comes in around the 150.00 (38.2% retracement) handle followed by the August 1990 high (151.65), but lack of momentum to clear the September high (145.90) may push USD/JPY back towards the 144.10 (100% expansion) region, with a break/close below the 143.00 (423.6% expansion) bringing the 141.70 (161.8% expansion) area back on the radar.
More By This Author:
Oil To Mirror August Price Action On Failure To Hold Above 50-Day SMA
USD/CAD Rate Pulls Back To Generate RSI Sell Signal
AUD/USD Rate Vulnerable To Dovish RBA Rate Hike

Comments
Log in or sign up to join the conversation.