

The price of oil trades to a fresh weekly high ($89.05) as it stages a four-day rally for the first time since August, and crude may attempt to test the September high ($90.39) as it continues to carve a series of higher highs and lows.
As a result, the shift in OPEC’s production schedule may lead to larger recovery in the price of oil with the organization on track to “adjust downward the overall production by 2 mb/d” starting in November, and it remains to be seen if the group will take additional steps at the next Ministerial Meeting on December 4 as rising interest rates across advanced economies dampen the outlook for global growth.
(Click on image to enlarge)
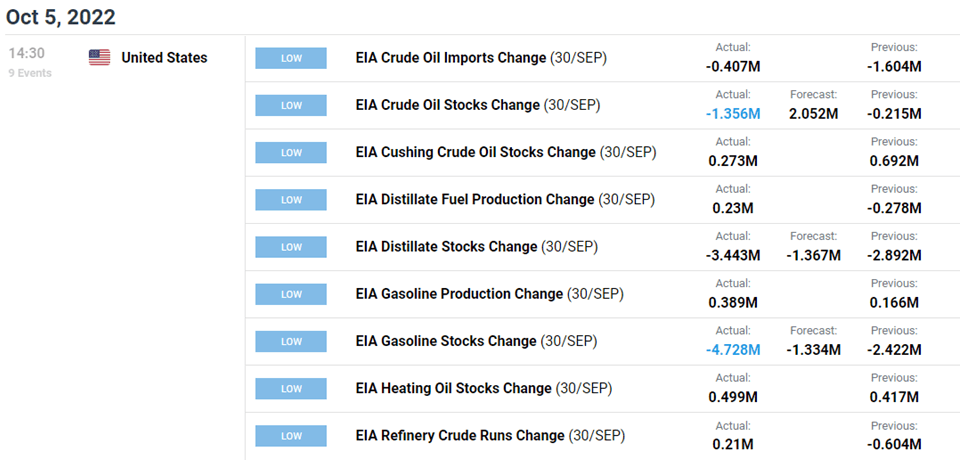
Until then, data prints coming out of the US may sway the price of oil as crude inventories unexpectedly contract for the second straight week, with stockpiles narrowing 1.356M in the week ending September 30 after falling 0.215M the week prior.
Signs of robust consumption may keep the price of oil above the January low ($74.27) amid the looming change in OPEC production, and current market conditions may lead to a break above the September high ($90.39) amid the stagnant recovery in US production.
(Click on image to enlarge)
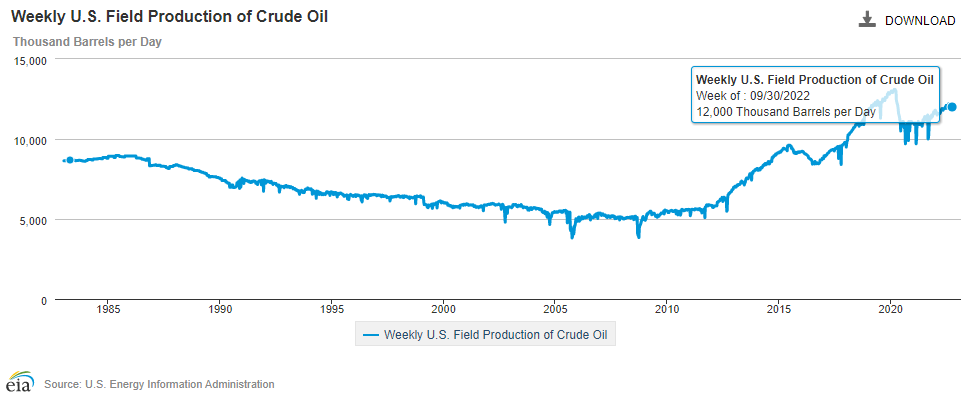
A deeper look at the figures from the Energy Information Administration (EIA) show weekly field production still below pre-pandemic levels, with the figure printing at 12,000K for the second week. In turn, expectations for less supply may fuel the bullish price action in crude as US output remains subdued, and the move above the 50-Day SMA ($88.08) may end up indicating a key reversal in the price of oil as it finds support ahead of the January low ($74.27).
With that said, the price of oil appears to be on track to test the September high ($90.39) as it extends the series of higher highs and lows from last week, but crude may mirror the price action from August if it continues to track the negative slope in the moving average.
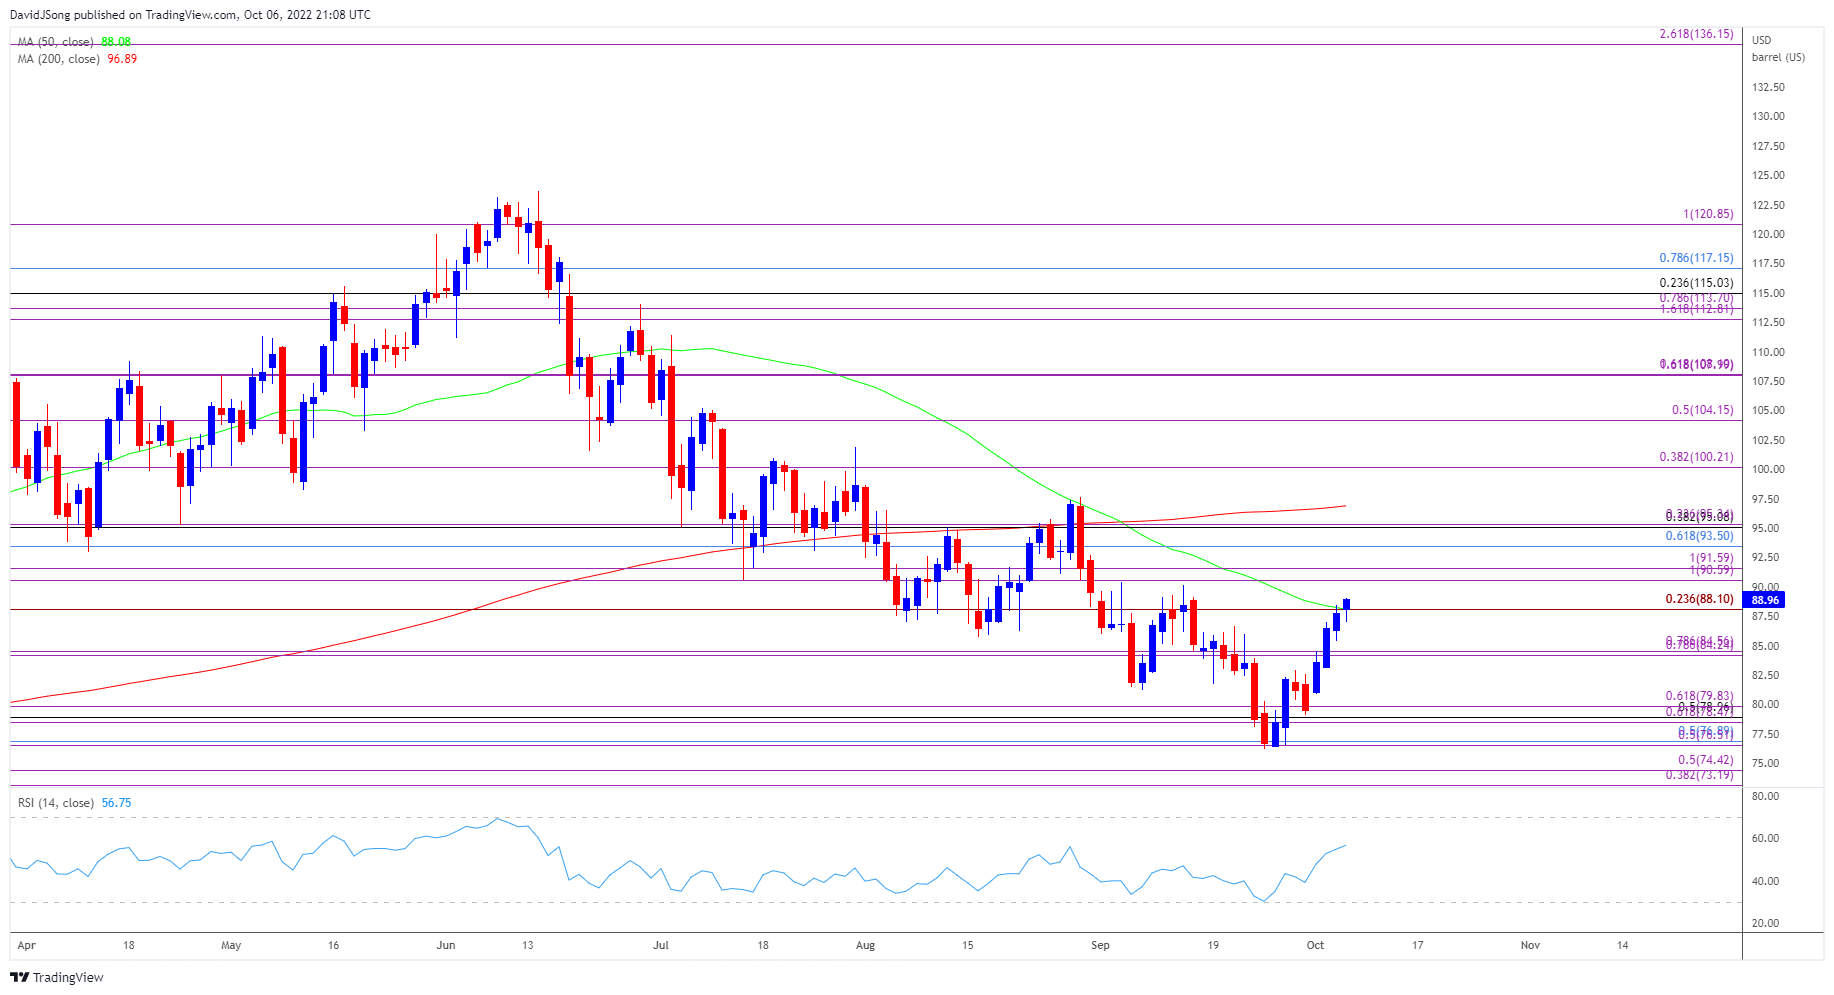
Crude Oil Price Daily Chart
(Click on image to enlarge)
Source: Trading View
- The price of oil appears to have reversed course following the failed attempts to close below the $76.50 (50% retracement) to $76.90 (50% retracement) region, with crude trading above the 50-Day SMA ($88.08) as it approaches the September high ($90.39).
- A break/close below the $90.60 (100% expansion) to $91.60 (100% expansion) area opens up the Fibonacci overlap around $93.50 (61.8% retracement) to $95.30 (23.6% expansion), but crude may mirror the price action from August if it continues to track the negative slope in the moving average.
- Failure to hold above $88.10 (23.6% expansion) may push the price of oil back towards the $84.20 (78.6% expansion) to $84.60 (78.6% expansion) area, with the next region of interest coming in around $78.50 (61.8% expansion) to $79.80 (61.8% expansion).
More By This Author:
USD/CAD Rate Pulls Back To Generate RSI Sell Signal
AUD/USD Rate Vulnerable To Dovish RBA Rate Hike
Gold Price Rebound Eyes Former Support Zone


Comments
Log in or sign up to join the conversation.