
Unlocking The Success Code: Coal India Indian Stocks Elliott Wave Technical Analysis
COAL INDIA – Elliott Wave Analysis Trading Lounge Day Chart
COAL INDIA Elliott Wave Technical Analysis
Function: Counter Trend
Mode: Corrective
Structure: Gray Wave B
Position: Orange Wave 4
Next Lower Degree Direction: Gray Wave C
Wave Cancel Invalid Level: 543.16
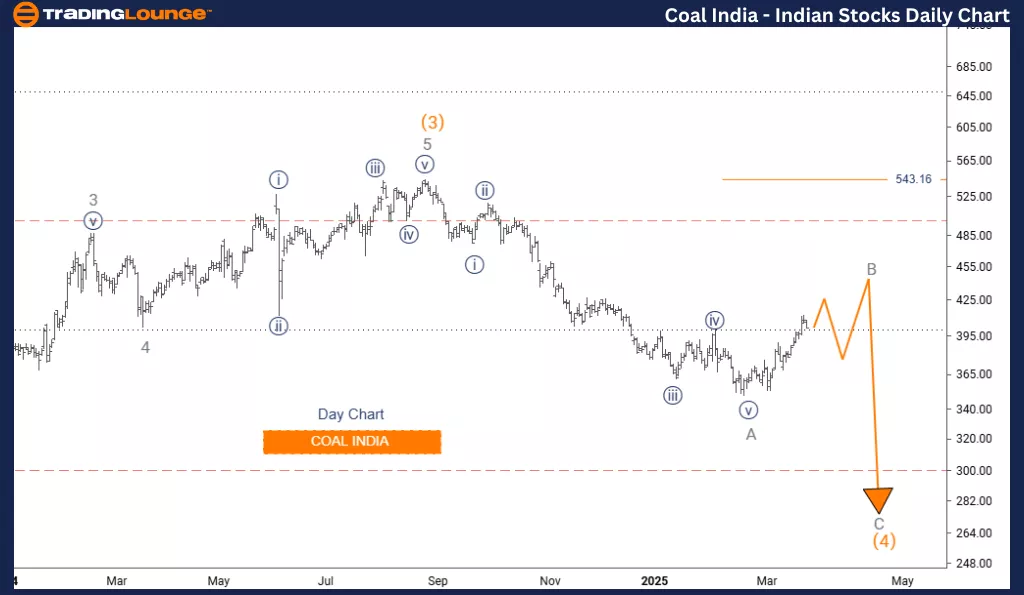
The daily Elliott Wave analysis for COAL INDIA highlights a counter-trend scenario, with the stock currently in a corrective phase. The focus is on gray wave B, part of the broader orange wave 4 structure. The completion of gray wave A's decline signals the beginning of gray wave B, which typically involves a retracement before the next leg down.
This suggests that the current movement may be temporary and followed by another potential drop in price, as wave C develops. The level to watch closely is 543.16. A move above this threshold would invalidate the present wave count and suggest a change in the current outlook.
The analysis expects gray wave C to follow the end of wave B, pointing to a continuation of the bearish phase. The daily timeframe helps traders stay focused on short- to medium-term movements within the broader context.
This technical outlook offers valuable guidance for those considering short trades or managing long positions. Completion of wave B may present short-selling opportunities ahead of wave C’s projected decline. Traders should track common corrective formations and signals confirming a potential turn.
Risk management remains essential. Any breach above 543.16 would challenge the current bearish stance. The setup provides a methodical view of COAL INDIA’s price dynamics under Elliott Wave principles.
COAL INDIA – Elliott Wave Analysis Trading Lounge Weekly Chart
COAL INDIA Elliott Wave Technical Analysis
Function: Counter Trend
Mode: Corrective
Structure: Gray Wave B
Position: Orange Wave 4
Next Lower Degree Direction: Gray Wave C
Wave Cancel Invalid Level: 543.16
The weekly Elliott Wave analysis for COAL INDIA outlines a counter-trend structure, placing the stock in a broader corrective phase. The focus is on gray wave B, a part of the higher-degree orange wave 4 formation. Gray wave A appears to have ended, and gray wave B is currently unfolding, representing a temporary retracement in an overall downward structure.
This movement is typical within corrections, often leading to sideways or upward action before resuming the dominant trend. A key level to monitor is 543.16. Any breach above this would invalidate the current wave interpretation and suggest a possible shift in market dynamics.
From a long-term perspective, the analysis projects that gray wave C will follow gray wave B, pointing toward a renewed bearish move. This view assists traders in positioning within the broader market cycle, particularly as gray wave B progresses.
This analysis underscores the significance of wave degree relationships and offers insight into how intermediate corrective waves like gray wave B integrate into the overall orange wave 4. Traders should watch for familiar corrective formations such as three-wave structures or consolidations.
Maintaining effective risk management near the invalidation level is advised, especially as the stock navigates through this correction ahead of a possible downward continuation.

Technical Analyst: Malik Awais
Source: TradingLounge.com – Learn from the experts!
More By This Author:
Unlocking ASX Trading Success: Insurance Australia Group Limited - Monday, March 24
Elliott Wave Technical Analysis - Microsoft Inc.
Elliott Wave Technical Analysis: Australian Dollar/U.S. Dollar - Monday, March 24
At TradingLounge™, we provide actionable Elliott Wave analysis across over 200 markets. Access live chat rooms, advanced AI & algorithmic charting tools, and curated trade ...
more

