
Understanding The Household Debt In Canada
Hardly a month goes by without some reference to Canadian indebtedness and why it represents a danger to the consumer and the economy as a whole. Analysts in the business media are quick to report that the debt-to-income ratio has gone up yet again and that Canadians are living beyond their means. The Governor of the Bank of Canada has on several occasions made reference to the Bank’s concern with the impact that rate hikes would have household finances.
The matter of household indebtedness looms large because it has been a major source of economic expansion in Canada, greater than the contributions to growth from business investment and international trade. When the Bank of Canada began a series of rate hikes starting mid-2017, analysts worried about how households were going to manage servicing existing debt at ever higher interest levels. More than 2/3rds of all outstanding household debt is related to mortgage debt or home equity lines of credit. Currently, the debt-to-income ratio is about 170%, nationally, and much higher in Vancouver and Toronto who have the highest home prices in the country.
But what does that number represent and is it a true measure of indebtedness?
Debt-to-Income Indicator
What does the debt-to-income measure? It is a measure of a “stock” (debt) against a ‘flow” (annual) income. Any graduate economics major would immediately spot the flaw in this measure. It is erroneous to compare a stock with a flow. For example, a mortgage is a debt that is payable over, say, 25 years. To compare that debt to one’s income, which is earned in just one year, totally ignores the most important factor ----- time. No one expects to pay off a mortgage in full from one year’s income. Yet, by focusing on this ratio, this suggests that there is either too much debt or too little income, neither conclusion can be reached by examining the ratio.
The Leverage Factor
A far better appreciation of financial risk occurs when we look at debt in connection with changes in the value of the stock of household assets. In other words, we compare two distinct “stocks”, debt against assets, both of which are valued over time. We need to see how the debt and assets change over time and what that implies for household net worth. The degree of leverage helps us understand the ability of households to liquidate assets to meet their existing financial obligations. This is the better test of indebtedness and how it can affect consumer behavior.
Figure 1
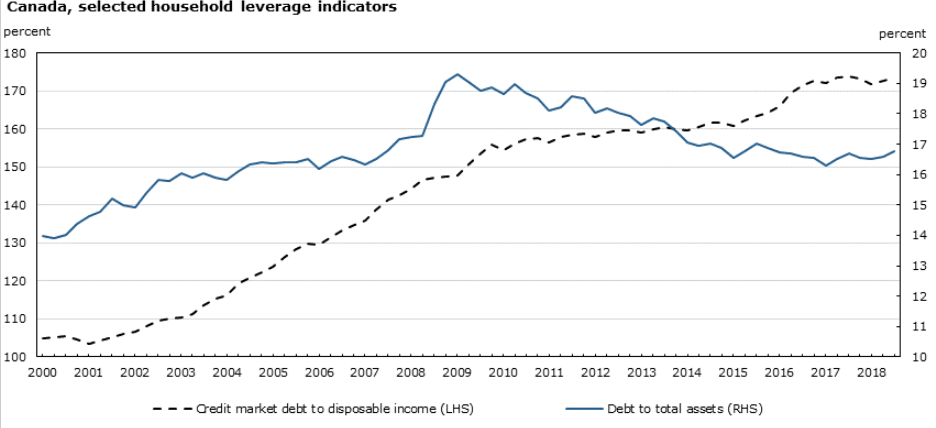
Source: Statistic Canada
Using a measure of leverage, ----debt liabilities measured against total assets --- we see that Canadians have been de-leveraging since the 2008 financial crisis (Figure 1). The debt liabilities of Canadian households, measured relative to the value of their total assets, trended lower in the years following the 2008 recession and continued to decline during 2015 and 2016. The downward trend in the debt-to-asset ratio demonstrates the relative strength of household asset growth in the post-recession period. Household assets rose by 68%, while household debt rose by 54% since 2009.
Figure 2
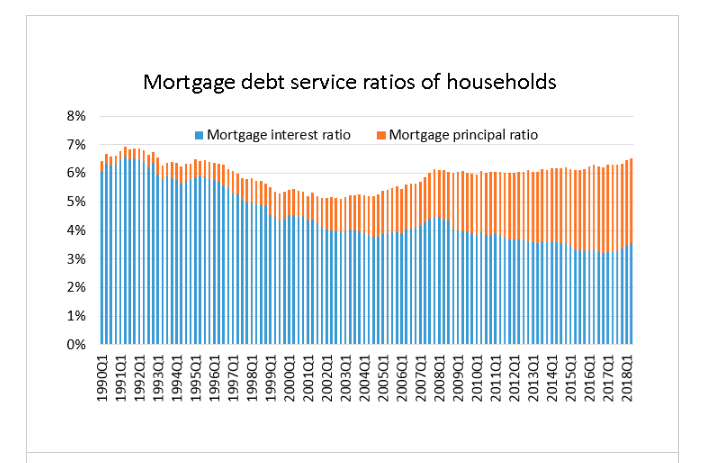
Source: Canada Mortgage and Housing Corporation, December 2018
Adding to the deleveraging from rising asset prices is the fact that Canadians are paying down principal on mortgages at a steady rate ( Figure 2). The Canadian Mortgage and Housing Corporation, the chief government agency insuring home loans, notes that:
Even though mortgage debt has risen, the share of household income needed to service mortgage debt has not varied dramatically over the last several years. The increasing share of income that goes to repayment of the principal represents equity accumulation, while the share that goes to interest is the cost of credit. The total cost of mortgage payments relative to total disposable income has hovered around the 6% mark for the past 10 years. The interest portion of household mortgage payments has, for the most part, been trending lower for about 25 years.[1]
It is fashionable in the financial press to have headlines which state that Canadians are living beyond their means. However, a closer look reveals a quite different story of deleveraging and responsible repayment of debt.
[1] https://www.cmhc-schl.gc.ca/en/housing-observer-online/2018-housing-observer/household-debt-income-ratio-near-record-high


How does the debt in Canada compare to the debt in America?