
This Week's CoT: What Hedge Funds, Noncommercials Are Buying
Following futures positions of non-commercials are as of May 17, 2022.
10-year note: Currently net short 160.1k, up 74.1k.
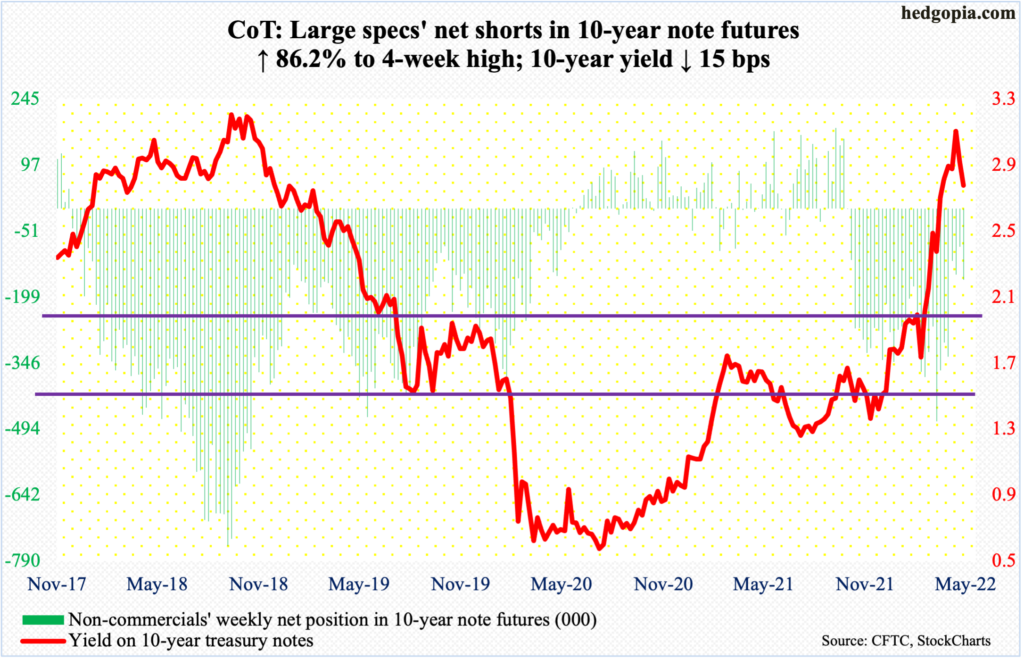
FOMC minutes for the May 3-4 meeting will be out next Wednesday. The fed funds rate was raised by 50 basis points in that meeting. This was the first increase of this magnitude in 22 years. This came on the heels of a 25-basis-point hike in March, which preceded a zero-bound monetary policy for two long years.
At the post-meeting press conference, Federal Reserve Chair Jerome Powell declared “inflation is much too high and we understand the hardship it is causing, and we are moving expeditiously to bring it back down,” but at the same time he said they are not “actively considering” a 75-basis-point move, rather a couple of 50.
Markets at the time were expecting a 75 in June (14-15). In the wake of Powell’s comments, futures traders have rerated expectations. Now, they expect a 50 each in June, July (26-27) and September (20-21) and a 25 each in November (1-2) and December (13-14), ending 2022 at 275 basis points to 300 basis points.
For futures traders to again rerate their rates expectations for the remainder of the year, the minutes need to contain something drastically different from what have been priced in already. Right here and now, it probably does not pay off to bet on this outcome.
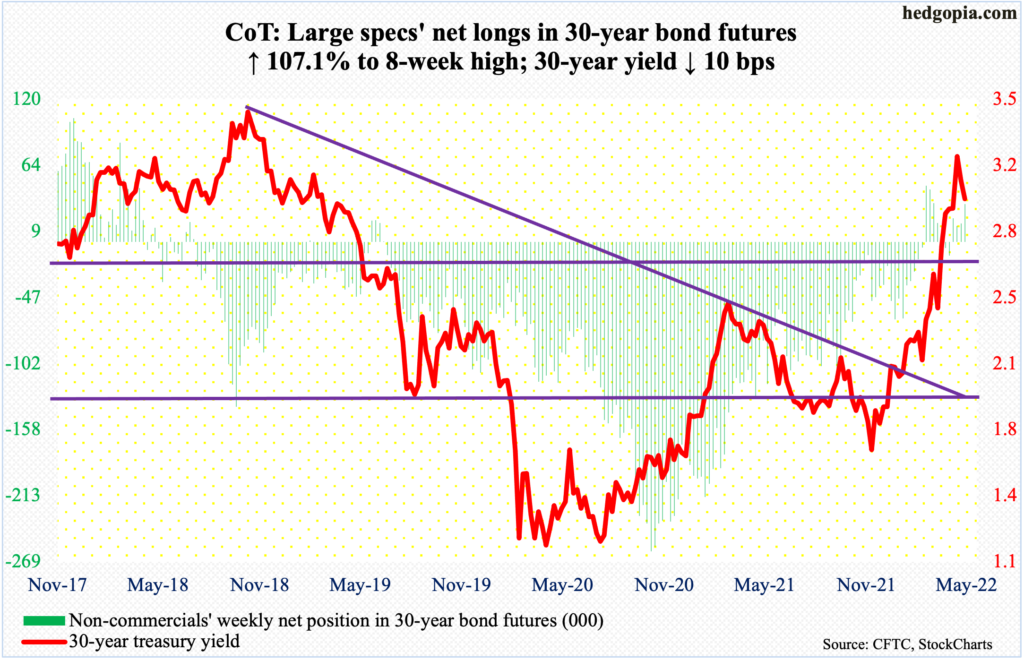
30-year bond: Currently net long 32k, up 16.6k.
Major economic releases for next week are as follows.
New home sales (April) are scheduled for Tuesday. March sales were down 8.6 percent month-over-month to a seasonally adjusted annual rate of 763,000 units – a four-month low. The median price posted a fresh high of $436,700.
Durable goods orders (April) will be published on Wednesday. Orders for non-defense capital goods ex-aircraft – proxy for business capex plans – increased 1.3 percent m/m to $81.1 billion (SAAR), which set a new record.
Gross domestic product (1Q22, second revision) and corporate profits (1Q22, preliminary) are due out Thursday.
The first estimate showed real GDP shrank 1.4 percent last quarter, which is the first contraction in seven quarters.
In 4Q21, corporate profits with inventory valuation and capital consumption adjustments shot up 21 percent year-over-year to $2.94 trillion (SAAR) – a new record.
Friday brings personal income/spending (April) and the University of Michigan’s consumer sentiment index (May, final).
In the 12 months to March, headline PCE (personal consumption expenditures) jumped 6.6 percent – the steepest rise since January 1982.
Preliminarily, consumer sentiment in May tumbled 6.1 points m/m to 59.1, which is the lowest print since August 2011.
WTI crude oil: Currently net long 348.3k, up 30.9k.
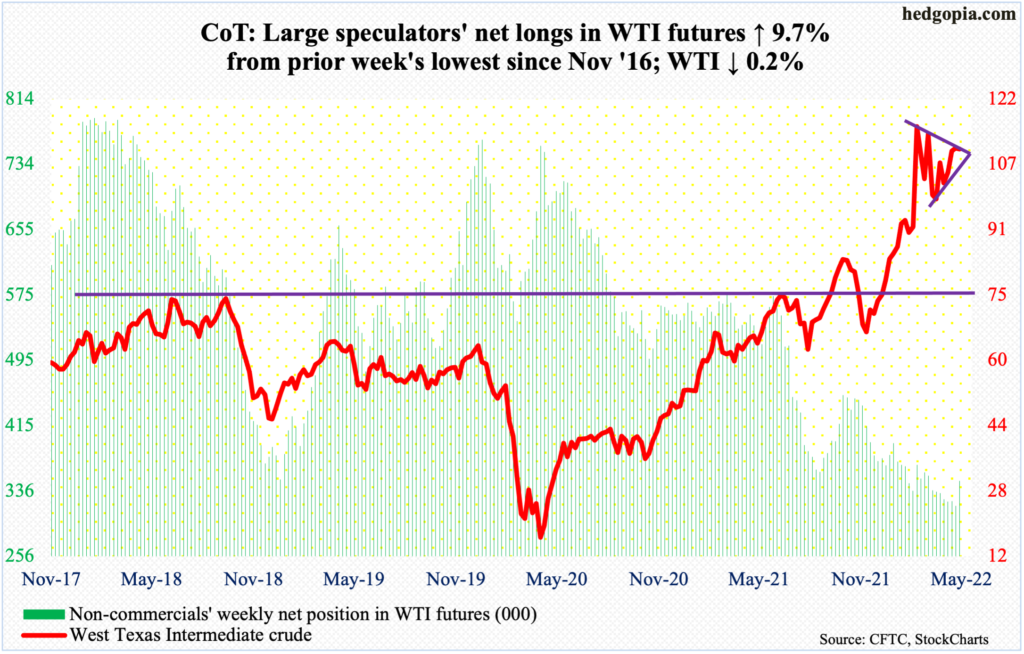
WTI ($110.28/barrel) continues to straddle the 50-day, closing each of the five sessions above the average but slightly breaching it intraday Thursday. This was the seven straight weeks the crude traded around the average ($104.62), which is flattish to slightly falling.
For more than a month now, WTI has made higher highs and higher lows, with a weekly high of $115.56 on Tuesday. This also attracted sellers, as resistance at $115-$116 goes back to early March. Tuesday’s high also marked the upper end of the one-plus-month ascending channel. The low end lies around $102.
Meanwhile, US crude production in the week to May 13 increased 100,000 barrels per day to 11.9 million b/d. As did crude imports, which grew 299,000 b/d to 6.6 mb/d. Stocks of distillates increased as well – up 1.2 million barrels to 105.3 million barrels. Stocks of crude and gasoline, however, declined – respectively down 3.4 million barrels and 4.8 million barrels to 420.8 million barrels and 220.2 million barrels. Refinery utilization rose 1.8 percentage points to 91.8 percent.
E-mini S&P 500: Currently net long 66.6k, down 55.1k.
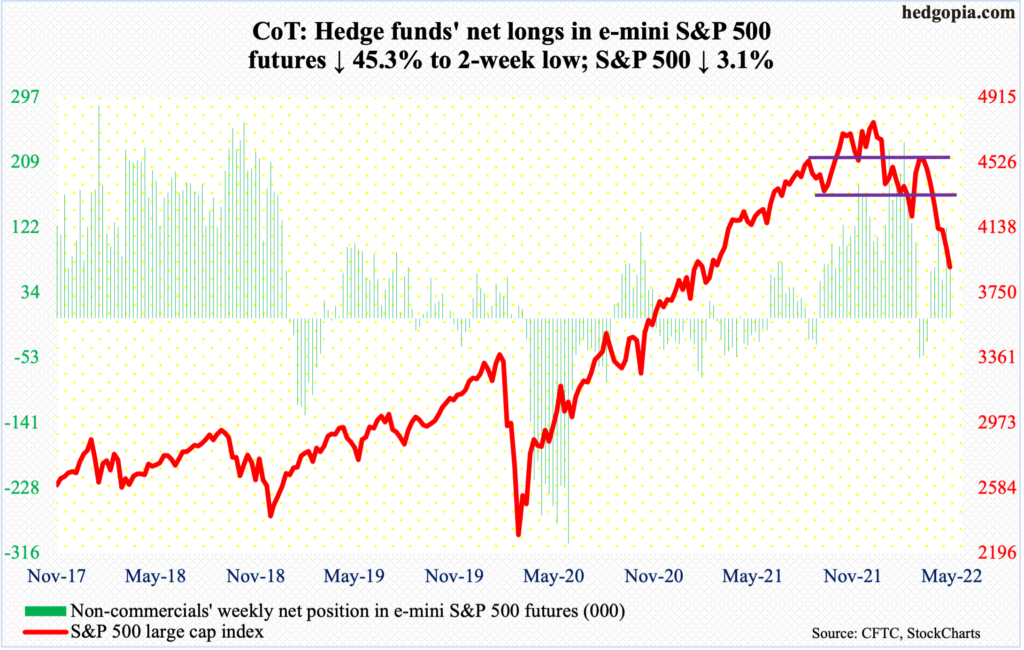
The rally off of the May 12 low soon petered out; through this Tuesday’s high, the S&P 500 rallied six percent before weakening in the next couple of sessions. Thursday’s long-legged doji session was a test of a spinning top session of a week ago. Come Friday, last week’s low was breached, ticking 3810 but recovering to end the week at 3901.
The large cap index dropped 3.1 percent for the week – its seventh consecutive weekly drop. Through Friday’s low, it tumbled 20.9 percent from the January 4 record high. That low kissed the lower end of a descending channel the S&P 500 has been in since early this year. The upper end lies at 4400.
Euro: Currently net long 20.3k, up 3.8k.
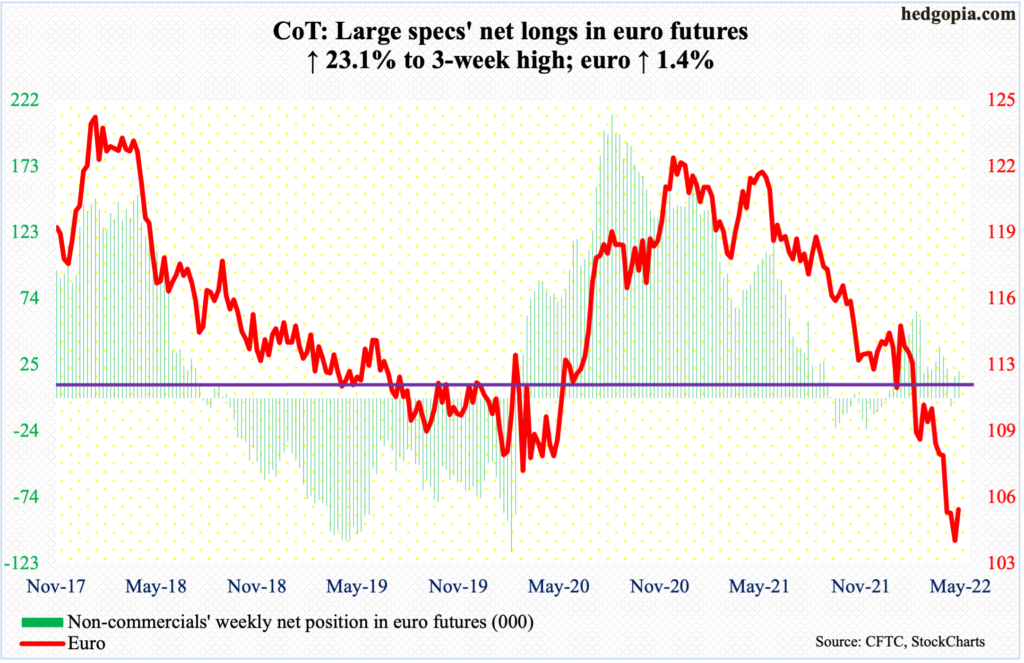
The euro probably just charted out a bullish island reversal. The gap-down on the 12th (this month) was followed by a gap-up the on the 17th. This follows persistent downward pressure the currency suffered since peaking at $1.2345 in January last year. Its recent low, posted last week, was $1.0350, which matched a low of $1.0341 reached in January 2017.
On Thursday, the euro ($1.0562) rallied as high as $1.0640 intraday, but the bulls were unable to hang on to it. Resistance at $1.05-$1.06 goes back seven years. It has struggled at $1.0580s since late April, including Friday. For further momentum, this needs to be taken out first.
Gold: Currently net long 175.4k, down 18k.
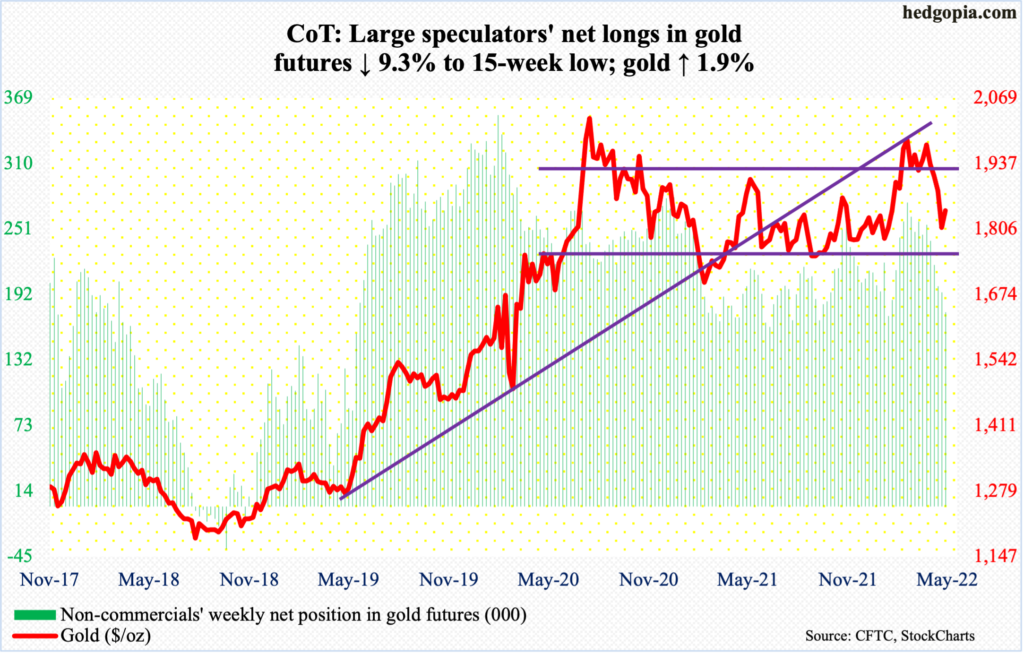
Gold bears picked up where they left off last week. After closing last week at $1,808, the metal touched $1,785 intraday Monday before attracting bids. There is major horizontal support at $1,750s. By Thursday, the yellow metal was up 1.9 percent for the week, slightly past the 200-day at $1,837.
Gold bugs need to reclaim $1,850s for further momentum. After that lies the make-or-break $1,920s. It ended the week at $1,842/ounce.
Nasdaq 100 index (mini): Currently net long 15.2k, up 1.7k.
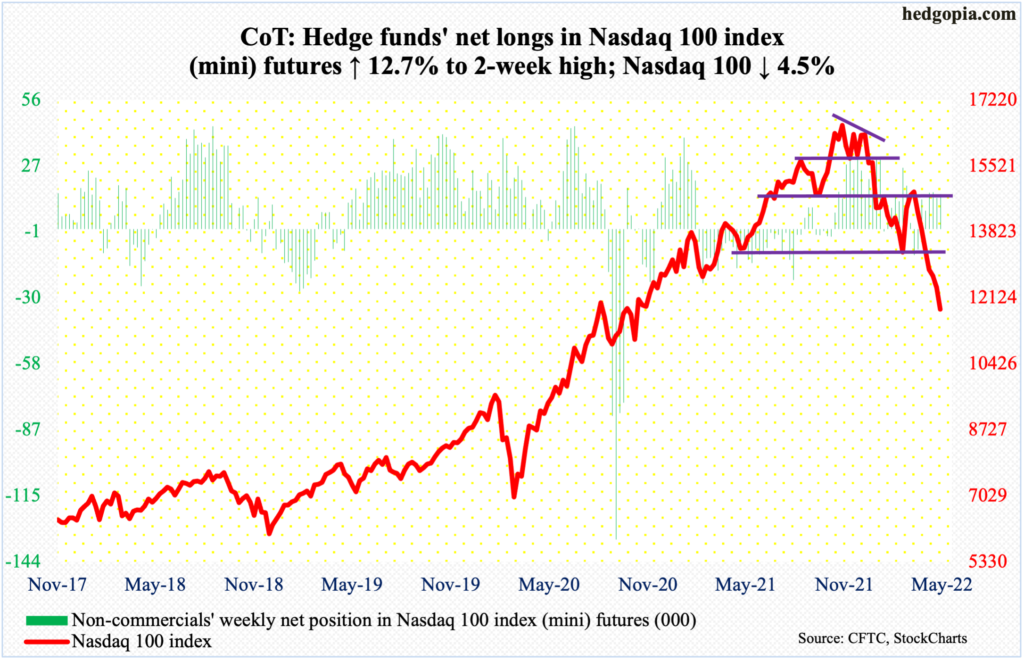
Like the S&P 500, the Nasdaq 100 this week kissed the lower end of a descending channel going back to late last year or early this year. Last week, the tech-heavy index tagged 11692, which was breached this Friday when it fell as low as 11492 intraday but only to reverse and close at 11836; through Friday’s low, the index tumbled 31.5 percent.
Tech bulls obviously do not want to see the Nasdaq 100 pierce through the channel it is in. But since it is a falling channel, new lows can still be made, which was the case this week. Friday’s hammer reversal is positive, and the session low is a must-hold for a rally to ensue in the sessions ahead.
Nearest resistance rests at 13000.
Russell 2000 mini-index: Currently net short 70k, up 426.
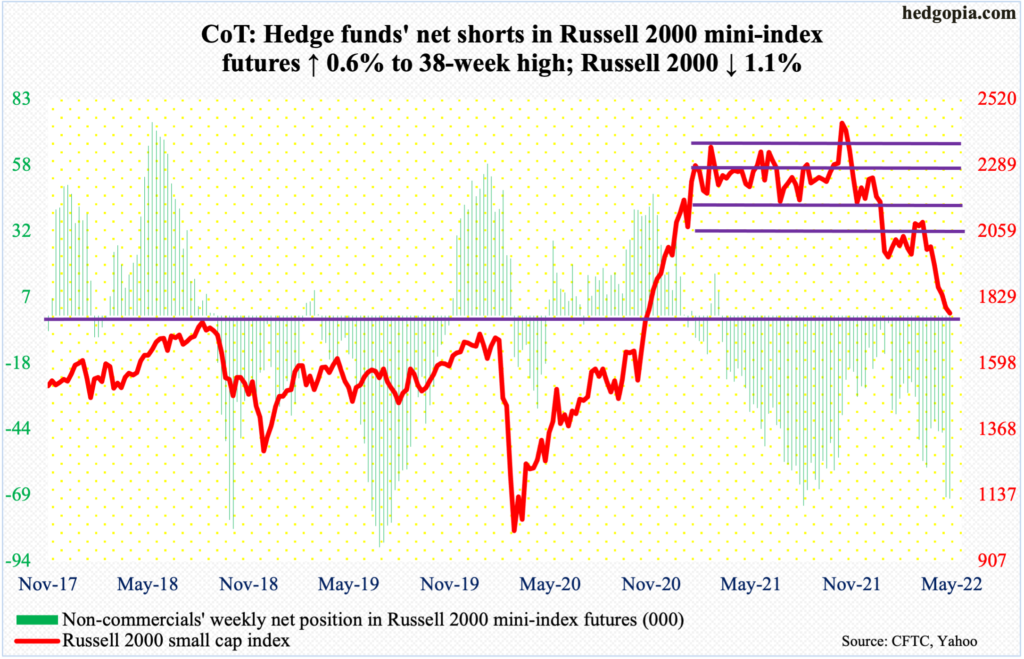
Small-caps fared better this week – relatively, that is. The Russell 2000 was down 1.1 percent, versus the S&P 500 down 3.1 percent and the Nasdaq 100 down 4.5 percent.
Small-caps traditionally outperform when investor mood gravitates toward risk-on. This is potentially positive in that the Russell 2000 between last November and last Thursday’s low of 1701, lost 30.8 percent. This week, the index (1773) was nowhere near testing that low; in contrast, both the S&P 500 and the Nasdaq 100 breached last week’s lows.
Should 1700 hold – odds are it will – this would represent a successful retest of a breakout from November 2000. In this scenario, the next major resistance lies at 1900. For nearly four months now, the index has played ping pong between 2080s and 1900, and for 10 months before that between 2080s and 2350s.
US Dollar Index: Currently net long 36.2k, up 1.4k.
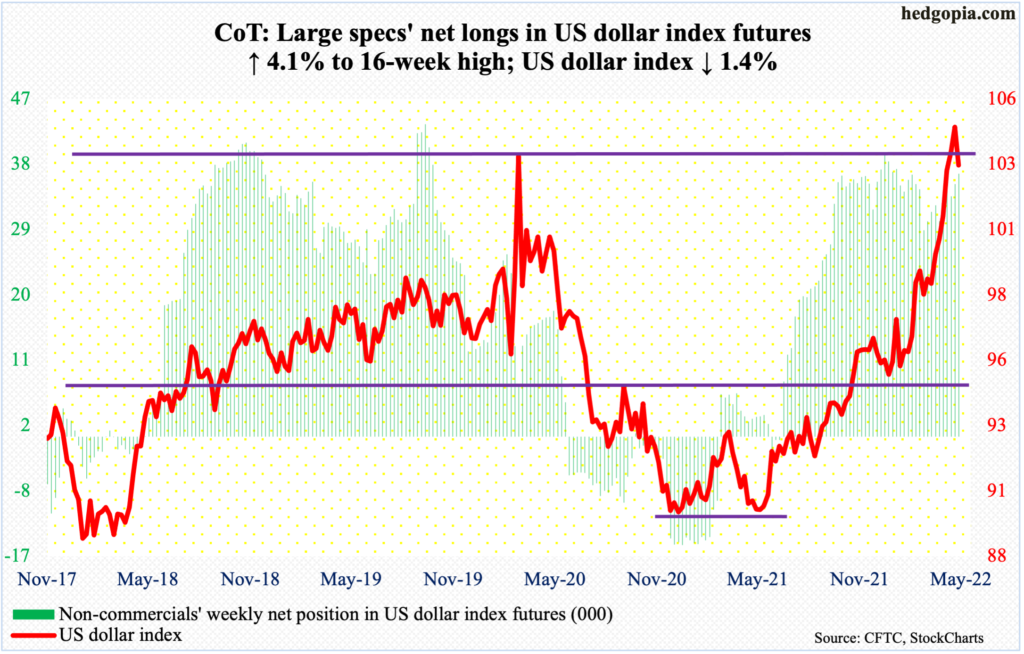
With seven sessions to go this month, the US dollar index is on track for a monthly long-legged doji with a long upper wick. If this pattern holds, this would have come after a 17.8-percent rally from the low of 89.17 posted in January last year. This week, it gave back 1.4 percent, nullifying last week’s breakout.
On the 12th, the US dollar index broke out of just south of 104, which acted as a ceiling going back to January 2017. Subsequently, it rallied as high as 105.06, which was posted on the 13th, but soon fatigue set in. Breakout retest failed on the 17th.
The index remains massively overbought on both the weekly and monthly. There is a lot to go on the downside before the extended conditions are unwound.
VIX: Currently net short 39.6k, down 8.3k.
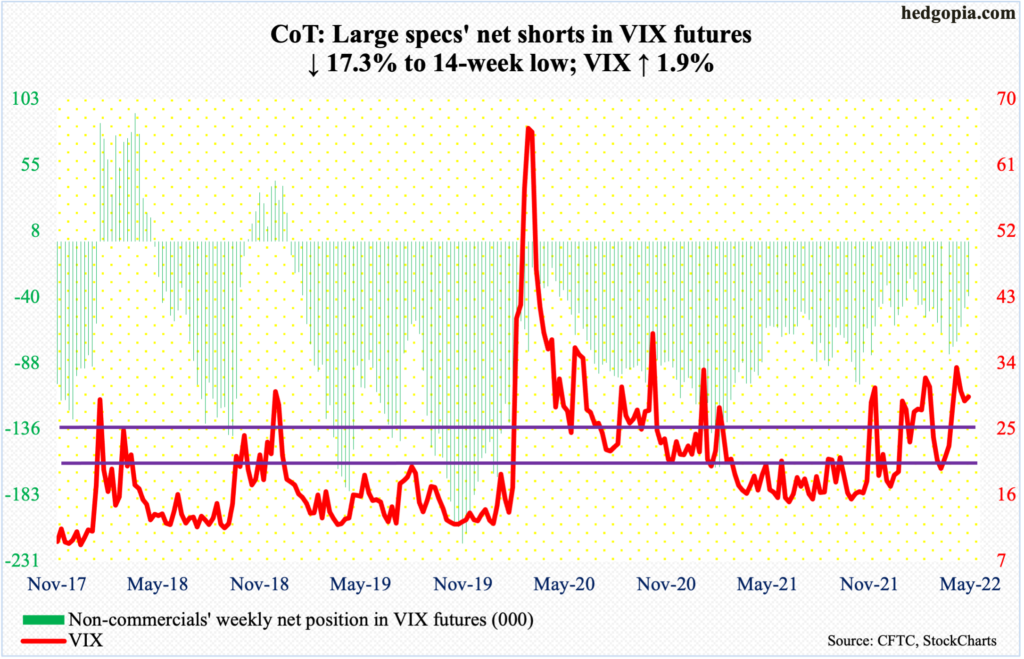
Yet another lower high on VIX this week. Volatility bulls were unable to cling on to Thursday’s high of 33.11, closing at 29.35, down 1.61 in the session; this is uncharacteristic of VIX as the S&P 500, too, fell 0.6 percent in that session.
The 33.11 print represents one more point in a series of lower highs since VIX hit 38.94 in January.
Support at mid-20s was defended on Tuesday as VIX (29.43) tagged 25.51. Odds favor this gets tested again in the sessions ahead. After this, there is support at low-20s. These levels respectively coincide with the 50- and 200-day (25.99 and 22.37, in that order).


