

Image Source: Pixabay
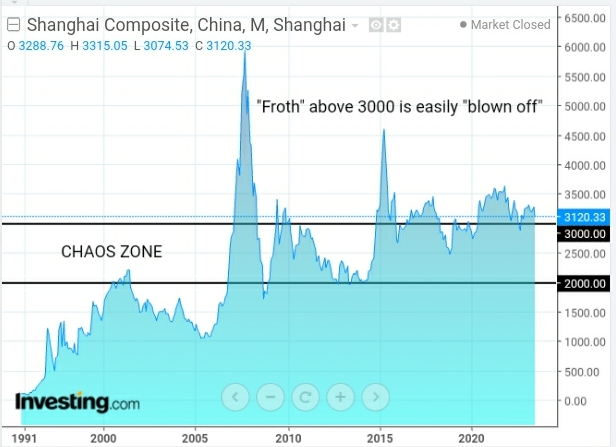
Every time China's Shanghai Index punched above 3000, it soon turned into "froth" and was, subsequently (and easily) blown away, only to retreat back into a large sideways Chaos Zone in between 2000 and 3000, as shown on the following monthly chart (SSEC).
Notwithstanding all of China's multiple efforts to shore up its considerable economic woes over the decades, nothing has been successful in the long run...and that's reflected in this chart.
Today's price is the same as it was in March of 2007.
I doubt that will change any time soon.

More By This Author:
SPX: Mired In Volatile 'Chaos Zone'
KBW Bank Index Looks Shaky
Credit Suisse Bank: From Bad To Worse


Comments
Log in or sign up to join the conversation.