
Here are the latest charts and statistics for the Commitment of Traders (COT) reports data published by the Commodities Futures Trading Commission (CFTC).
The latest COT data is updated through Tuesday April 4th and shows a quick view of how large traders (for-profit speculators and commercial entities) were positioned in the futures markets.
Weekly Speculator Changes led by Sugar & Soybeans
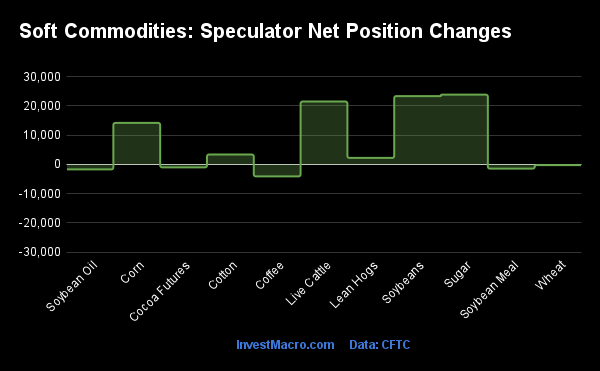
The COT soft commodities markets speculator bets were a little higher this week as six out of the eleven softs markets we cover had higher positioning while the other five markets had lower speculator contracts.
Leading the gains for the softs markets was Sugar (23,822 contracts) with Soybeans (23,325 contracts), Live Cattle (21,476 contracts), Corn (14,162 contracts), Lean Hogs (2,214 contracts) and Cotton (3,378 contracts) also showing positive weeks.
The markets with the declines in speculator bets this week were Coffee (-4,103 contracts) with Soybean Meal (-1,439 contracts), Cocoa (-1,028 contracts), Soybean Oil (-1,717 contracts) and Wheat (-254 contracts) also registering lower bets on the week.
Sugar Speculator bets rise higher as Futures prices hit highest level since 2016
Highlighting the COT soft commodities data this week is the gains in the Sugar speculator’s bullish positioning. The large speculator bets for Sugar rose this week by over +23,000 contracts and have gained for two straight weeks as well as for three out of the past five weeks. The bullish sentiment has pushed the Sugar net speculator positions to their highest level in nine weeks and are currently also at the second highest level since November of 2021 with a current net position of +246,651 contracts.
Sugar’s speculator strength score level has been on the rise with a current score of 79 percent (out of a 3-year range on a 0-100 percent scale) while its 6-week strength score trend has increased by 5 percent.
The Sugar futures price has been in a strong bullish trend, climbing for a third consecutive week and closing out the week higher by over 8 percent. This week’s front month futures price reached above $23.00 which is the highest prices have touched since 2016. Overall, Sugar prices are up by approximately 25 percent since the start of the year.
|
Apr-04-2023
|
OI
|
OI-Index
|
Spec-Net
|
Spec-Index
|
Com-Net
|
COM-Index
|
Smalls-Net
|
Smalls-Index
|
|---|---|---|---|---|---|---|---|---|
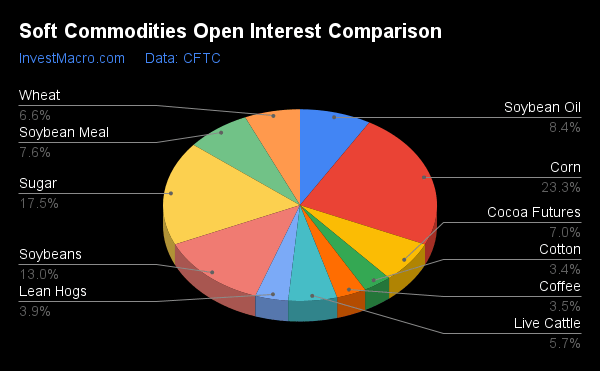
| WTI Crude | 1,858,446 | 41 | 226,127 | 17 | -239,970 | 86 | 13,843 | 22 |
| Natural Gas | 1,365,656 | 81 | -130,485 | 20 | 100,737 | 80 | 29,748 | 51 |
| Corn | 1,334,671 | 19 | 85,690 | 41 | -53,314 | 64 | -32,376 | 40 |
| Sugar | 1,005,892 | 72 | 246,651 | 79 | -304,019 | 16 | 57,368 | 79 |
| Soybeans | 746,111 | 37 | 184,345 | 62 | -163,267 | 40 | -21,078 | 37 |
| Gold | 476,592 | 25 | 195,216 | 63 | -218,250 | 40 | 23,034 | 38 |
| Wheat | 375,999 | 52 | -60,799 | 10 | 54,864 | 85 | 5,935 | 100 |
| Heating Oil | 270,347 | 24 | 4,856 | 35 | -22,607 | 65 | 17,751 | 60 |
| Copper | 218,687 | 57 | -2,954 | 26 | -4,897 | 69 | 7,851 | 68 |
| Coffee | 201,425 | 13 | 12,648 | 40 | -13,119 | 63 | 471 | 18 |
| Brent | 146,925 | 11 | -38,540 | 30 | 33,701 | 67 | 4,839 | 75 |
| Silver | 131,210 | 16 | 21,283 | 49 | -31,435 | 56 | 10,152 | 23 |
| Platinum | 59,156 | 38 | 15,423 | 51 | -19,201 | 54 | 3,778 | 19 |
| Palladium | 11,820 | 82 | -6,646 | 4 | 7,011 | 97 | -365 | 20 |
Strength Scores led by Cocoa & Sugar
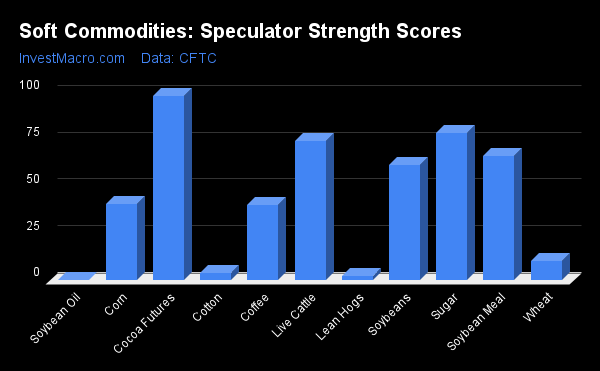
COT Strength Scores (a normalized measure of Speculator positions over a 3-Year range, from 0 to 100 where above 80 is Extreme-Bullish and below 20 is Extreme-Bearish) showed that Cocoa (99 percent) and Sugar (79 percent) lead the softs markets this week. Live Cattle (75 percent), Soybean Meal (67 percent) and Soybeans (62 percent) come in as the next highest in the weekly strength scores.
On the downside, Soybean Oil (0 percent), Lean Hogs (2 percent), Cotton (4 percent) and Wheat (10 percent) come in at the lowest strength levels currently and are in Extreme-Bearish territory (below 20 percent).
Strength Statistics:
Corn (41.0 percent) vs Corn previous week (39.2 percent)
Sugar (78.7 percent) vs Sugar previous week (70.5 percent)
Coffee (40.4 percent) vs Coffee previous week (44.6 percent)
Soybeans (61.6 percent) vs Soybeans previous week (52.4 percent)
Soybean Oil (0.0 percent) vs Soybean Oil previous week (1.1 percent)
Soybean Meal (66.7 percent) vs Soybean Meal previous week (67.4 percent)
Live Cattle (74.7 percent) vs Live Cattle previous week (50.6 percent)
Lean Hogs (2.1 percent) vs Lean Hogs previous week (0.0 percent)
Cotton (3.6 percent) vs Cotton previous week (1.1 percent)
Cocoa (98.7 percent) vs Cocoa previous week (100.0 percent)
Wheat (10.4 percent) vs Wheat previous week (10.6 percent)
Cocoa & Sugar top the 6-Week Strength Trends
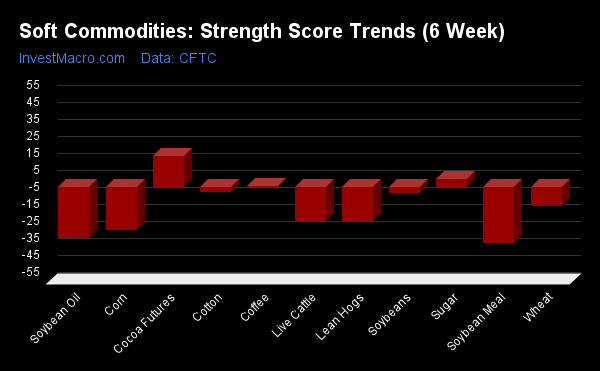
COT Strength Score Trends (or move index, calculates the 6-week changes in strength scores) showed that Cocoa (18 percent) and Sugar (5 percent) lead the past six weeks trends for soft commodities. Coffee (0.3 percent) is the next highest positive mover in the latest trends data.
Soybean Meal (-33 percent) leads the downside trend scores currently with Soybean Oil (-30 percent), Corn (-25 percent) and Lean Hogs (-20 percent) following next with lower trend scores.
Strength Trend Statistics:
Corn (-25.2 percent) vs Corn previous week (-29.8 percent)
Sugar (4.6 percent) vs Sugar previous week (-5.5 percent)
Coffee (0.3 percent) vs Coffee previous week (12.0 percent)
Soybeans (-3.5 percent) vs Soybeans previous week (-12.1 percent)
Soybean Oil (-30.3 percent) vs Soybean Oil previous week (-24.4 percent)
Soybean Meal (-32.8 percent) vs Soybean Meal previous week (-30.1 percent)
Live Cattle (-20.3 percent) vs Live Cattle previous week (-40.5 percent)
Lean Hogs (-20.0 percent) vs Lean Hogs previous week (-15.0 percent)
Cotton (-2.8 percent) vs Cotton previous week (-16.0 percent)
Cocoa (18.1 percent) vs Cocoa previous week (41.4 percent)
Wheat (-11.1 percent) vs Wheat previous week (-22.0 percent)
Individual Soft Commodities Markets:
CORN Futures:
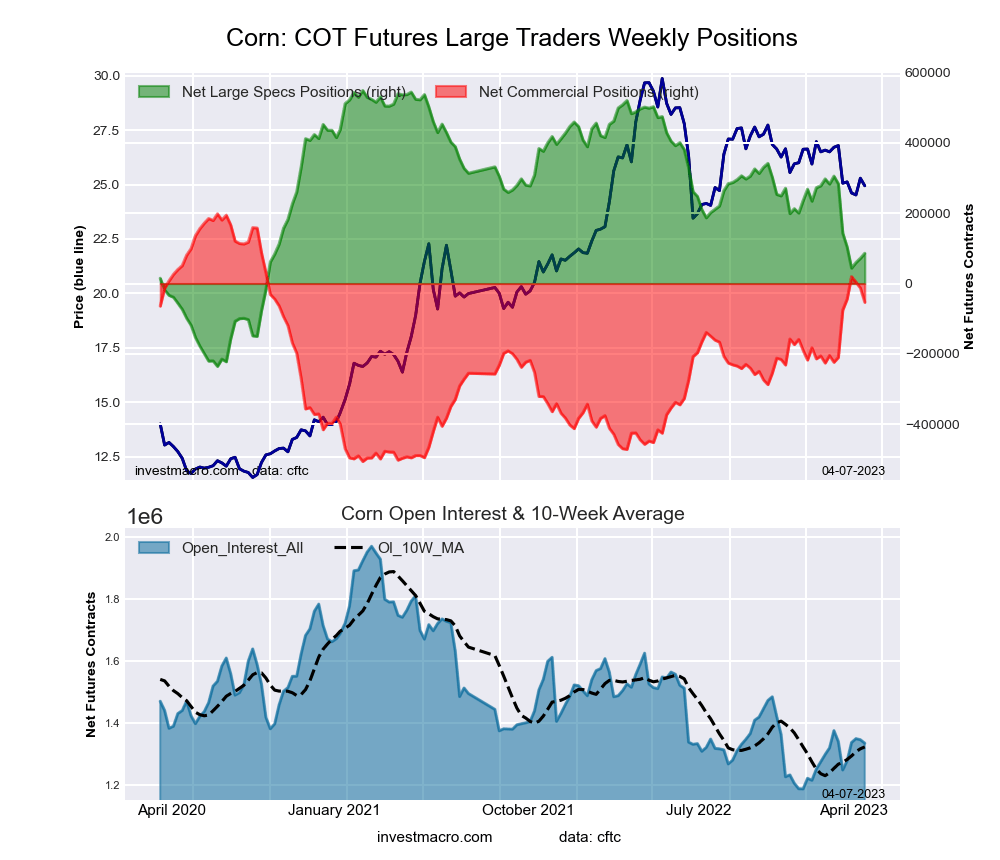
The CORN large speculator standing this week resulted in a net position of 85,690 contracts in the data reported through Tuesday. This was a weekly increase of 14,162 contracts from the previous week which had a total of 71,528 net contracts.
This week’s current strength score (the trader positioning range over the past three years, measured from 0 to 100) shows the speculators are currently Bearish with a score of 41.0 percent. The commercials are Bullish with a score of 64.3 percent and the small traders (not shown in chart) are Bearish with a score of 40.0 percent.
| CORN Futures Statistics | SPECULATORS | COMMERCIALS | SMALL TRADERS |
| – Percent of Open Interest Longs: | 23.2 | 48.3 | 10.0 |
| – Percent of Open Interest Shorts: | 16.8 | 52.3 | 12.5 |
| – Net Position: | 85,690 | -53,314 | -32,376 |
| – Gross Longs: | 310,288 | 644,140 | 134,134 |
| – Gross Shorts: | 224,598 | 697,454 | 166,510 |
| – Long to Short Ratio: | 1.4 to 1 | 0.9 to 1 | 0.8 to 1 |
| NET POSITION TREND: | |||
| – Strength Index Score (3 Year Range Pct): | 41.0 | 64.3 | 40.0 |
| – Strength Index Reading (3 Year Range): | Bearish | Bullish | Bearish |
| NET POSITION MOVEMENT INDEX: | |||
| – 6-Week Change in Strength Index: | -25.2 | 22.2 | 33.7 |
SUGAR Futures:
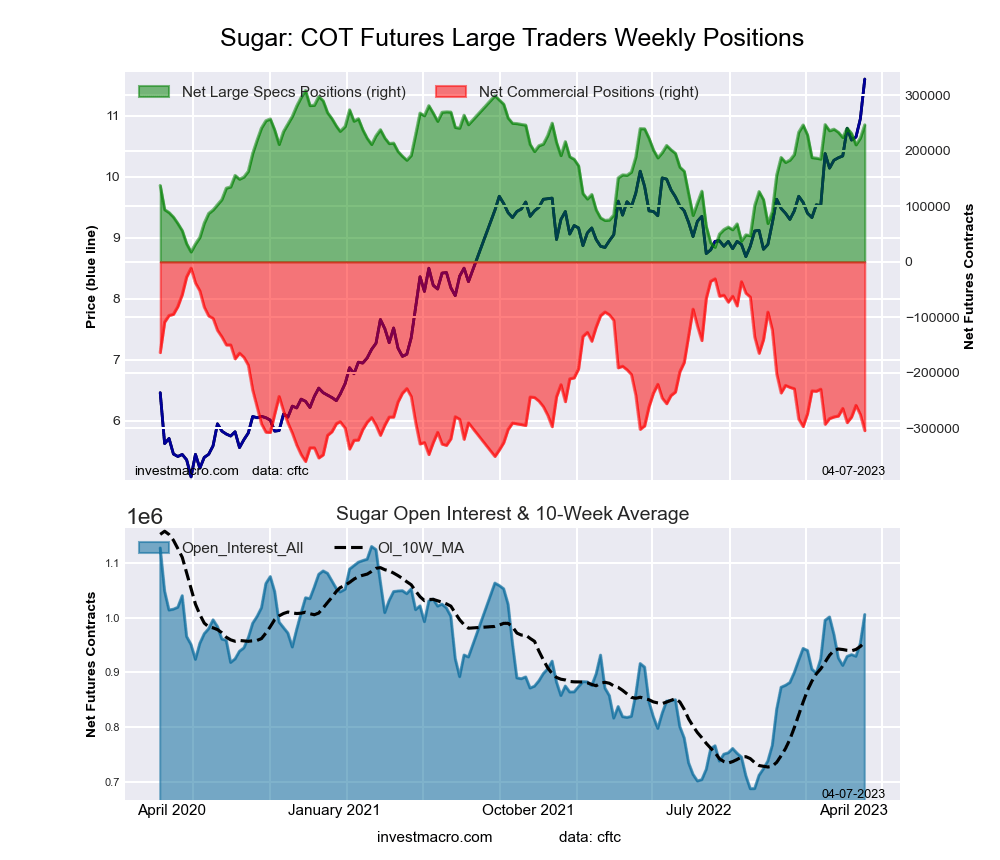
The SUGAR large speculator standing this week resulted in a net position of 246,651 contracts in the data reported through Tuesday. This was a weekly boost of 23,822 contracts from the previous week which had a total of 222,829 net contracts.
This week’s current strength score (the trader positioning range over the past three years, measured from 0 to 100) shows the speculators are currently Bullish with a score of 78.7 percent. The commercials are Bearish-Extreme with a score of 15.9 percent and the small traders (not shown in chart) are Bullish with a score of 78.8 percent.
| SUGAR Futures Statistics | SPECULATORS | COMMERCIALS | SMALL TRADERS |
| – Percent of Open Interest Longs: | 32.6 | 38.6 | 10.7 |
| – Percent of Open Interest Shorts: | 8.1 | 68.9 | 5.0 |
| – Net Position: | 246,651 | -304,019 | 57,368 |
| – Gross Longs: | 328,123 | 388,632 | 107,776 |
| – Gross Shorts: | 81,472 | 692,651 | 50,408 |
| – Long to Short Ratio: | 4.0 to 1 | 0.6 to 1 | 2.1 to 1 |
| NET POSITION TREND: | |||
| – Strength Index Score (3 Year Range Pct): | 78.7 | 15.9 | 78.8 |
| – Strength Index Reading (3 Year Range): | Bullish | Bearish-Extreme | Bullish |
| NET POSITION MOVEMENT INDEX: | |||
| – 6-Week Change in Strength Index: | 4.6 | -7.5 | 16.0 |
COFFEE Futures:
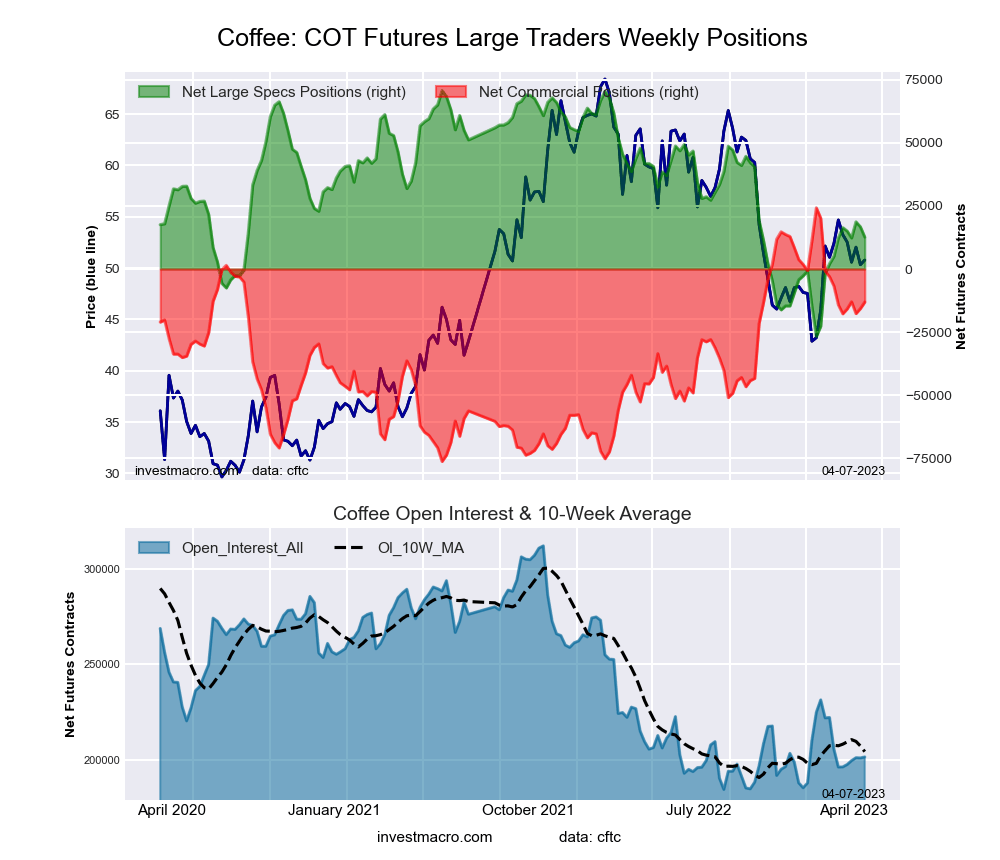
The COFFEE large speculator standing this week resulted in a net position of 12,648 contracts in the data reported through Tuesday. This was a weekly lowering of -4,103 contracts from the previous week which had a total of 16,751 net contracts.
This week’s current strength score (the trader positioning range over the past three years, measured from 0 to 100) shows the speculators are currently Bearish with a score of 40.4 percent. The commercials are Bullish with a score of 62.8 percent and the small traders (not shown in chart) are Bearish-Extreme with a score of 18.3 percent.
| COFFEE Futures Statistics | SPECULATORS | COMMERCIALS | SMALL TRADERS |
| – Percent of Open Interest Longs: | 18.9 | 49.2 | 4.5 |
| – Percent of Open Interest Shorts: | 12.6 | 55.7 | 4.2 |
| – Net Position: | 12,648 | -13,119 | 471 |
| – Gross Longs: | 37,985 | 99,174 | 9,019 |
| – Gross Shorts: | 25,337 | 112,293 | 8,548 |
| – Long to Short Ratio: | 1.5 to 1 | 0.9 to 1 | 1.1 to 1 |
| NET POSITION TREND: | |||
| – Strength Index Score (3 Year Range Pct): | 40.4 | 62.8 | 18.3 |
| – Strength Index Reading (3 Year Range): | Bearish | Bullish | Bearish-Extreme |
| NET POSITION MOVEMENT INDEX: | |||
| – 6-Week Change in Strength Index: | 0.3 | 1.1 | -17.1 |
SOYBEANS Futures:
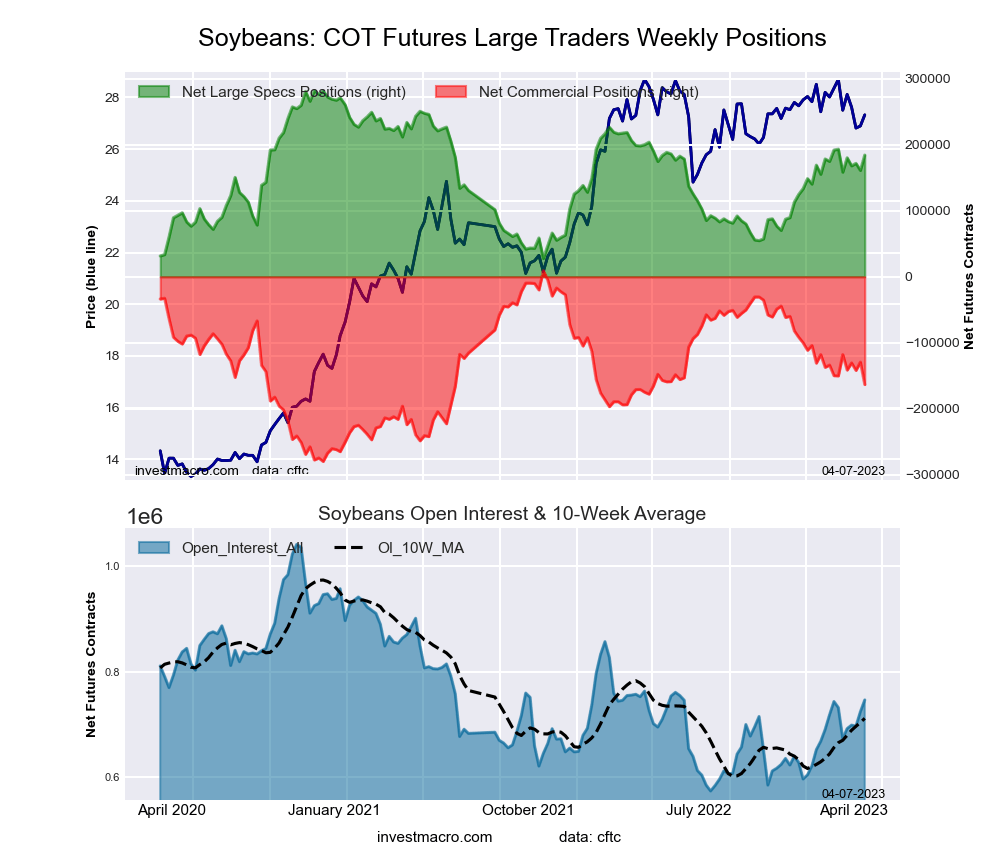
The SOYBEANS large speculator standing this week resulted in a net position of 184,345 contracts in the data reported through Tuesday. This was a weekly increase of 23,325 contracts from the previous week which had a total of 161,020 net contracts.
This week’s current strength score (the trader positioning range over the past three years, measured from 0 to 100) shows the speculators are currently Bullish with a score of 61.6 percent. The commercials are Bearish with a score of 40.3 percent and the small traders (not shown in chart) are Bearish with a score of 36.7 percent.
| SOYBEANS Futures Statistics | SPECULATORS | COMMERCIALS | SMALL TRADERS |
| – Percent of Open Interest Longs: | 28.8 | 43.1 | 7.6 |
| – Percent of Open Interest Shorts: | 4.1 | 65.0 | 10.5 |
| – Net Position: | 184,345 | -163,267 | -21,078 |
| – Gross Longs: | 214,749 | 321,612 | 57,051 |
| – Gross Shorts: | 30,404 | 484,879 | 78,129 |
| – Long to Short Ratio: | 7.1 to 1 | 0.7 to 1 | 0.7 to 1 |
| NET POSITION TREND: | |||
| – Strength Index Score (3 Year Range Pct): | 61.6 | 40.3 | 36.7 |
| – Strength Index Reading (3 Year Range): | Bullish | Bearish | Bearish |
| NET POSITION MOVEMENT INDEX: | |||
| – 6-Week Change in Strength Index: | -3.5 | -4.5 | 36.7 |
SOYBEAN OIL Futures:
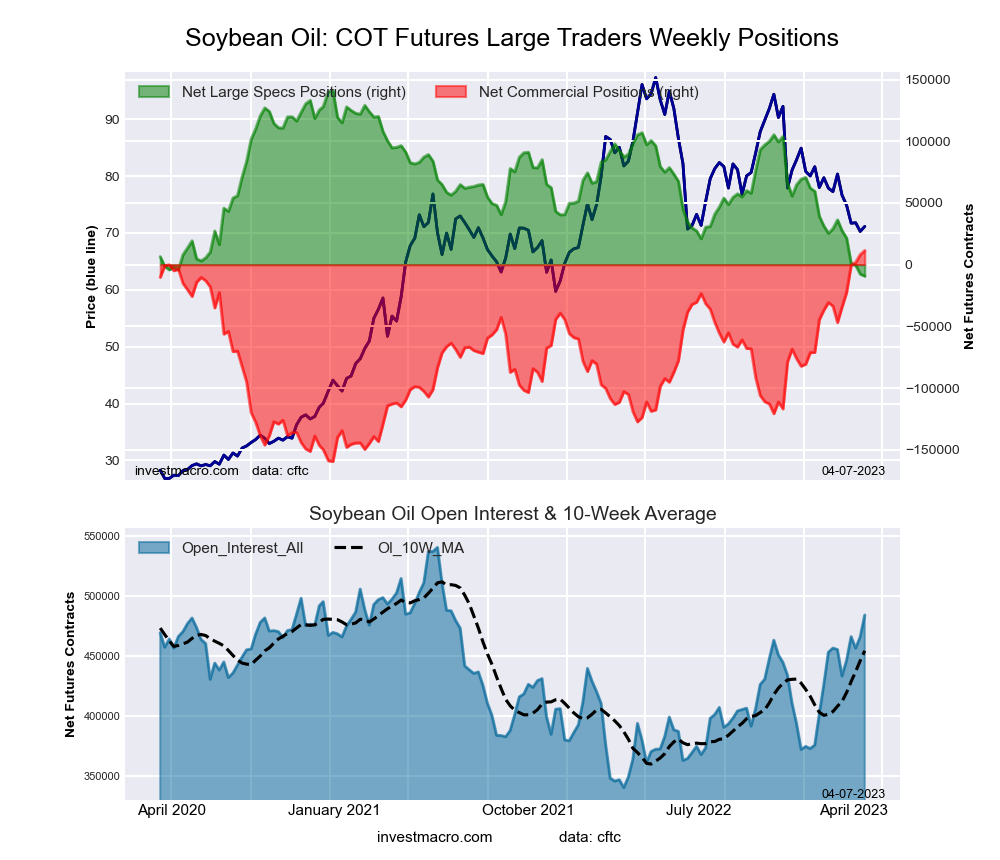
The SOYBEAN OIL large speculator standing this week resulted in a net position of -9,325 contracts in the data reported through Tuesday. This was a weekly reduction of -1,717 contracts from the previous week which had a total of -7,608 net contracts.
This week’s current strength score (the trader positioning range over the past three years, measured from 0 to 100) shows the speculators are currently Bearish-Extreme with a score of 0.0 percent. The commercials are Bullish-Extreme with a score of 100.0 percent and the small traders (not shown in chart) are Bearish-Extreme with a score of 0.0 percent.
| SOYBEAN OIL Futures Statistics | SPECULATORS | COMMERCIALS | SMALL TRADERS |
| – Percent of Open Interest Longs: | 14.0 | 58.8 | 6.1 |
| – Percent of Open Interest Shorts: | 15.9 | 56.5 | 6.5 |
| – Net Position: | -9,325 | 11,432 | -2,107 |
| – Gross Longs: | 67,755 | 284,781 | 29,453 |
| – Gross Shorts: | 77,080 | 273,349 | 31,560 |
| – Long to Short Ratio: | 0.9 to 1 | 1.0 to 1 | 0.9 to 1 |
| NET POSITION TREND: | |||
| – Strength Index Score (3 Year Range Pct): | 0.0 | 100.0 | 0.0 |
| – Strength Index Reading (3 Year Range): | Bearish-Extreme | Bullish-Extreme | Bearish-Extreme |
| NET POSITION MOVEMENT INDEX: | |||
| – 6-Week Change in Strength Index: | -30.3 | 34.1 | -50.2 |
SOYBEAN MEAL Futures:
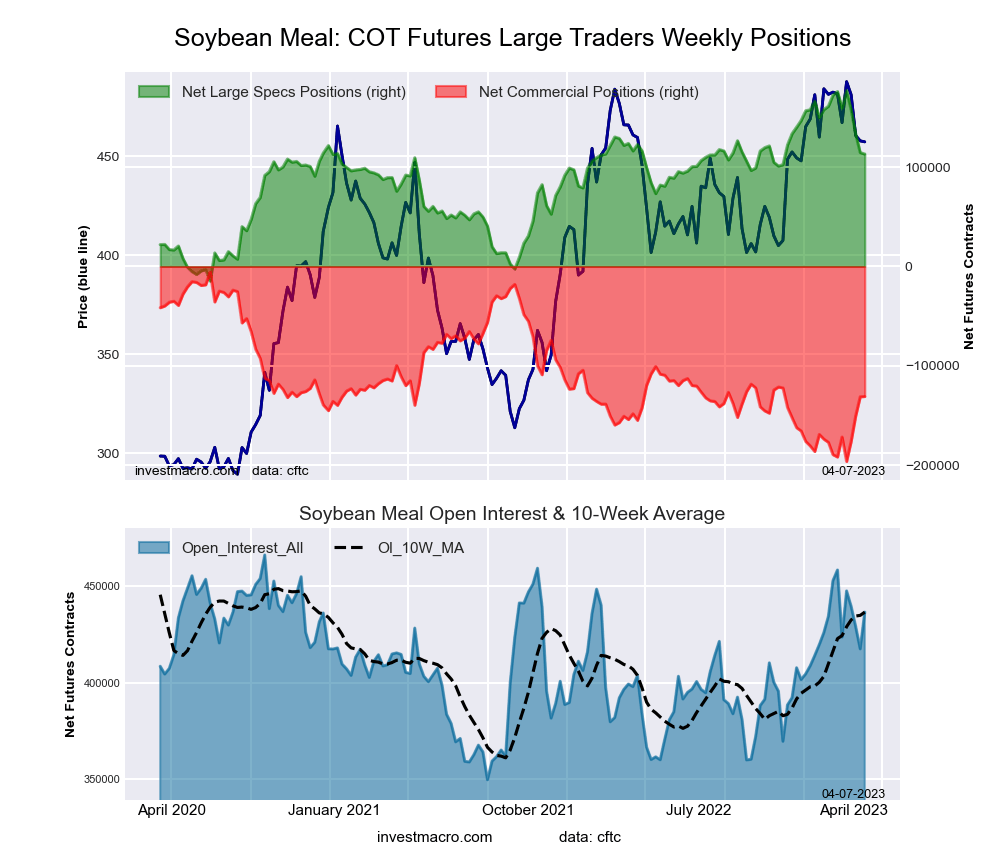
The SOYBEAN MEAL large speculator standing this week resulted in a net position of 113,102 contracts in the data reported through Tuesday. This was a weekly decline of -1,439 contracts from the previous week which had a total of 114,541 net contracts.
This week’s current strength score (the trader positioning range over the past three years, measured from 0 to 100) shows the speculators are currently Bullish with a score of 66.7 percent. The commercials are Bearish with a score of 34.3 percent and the small traders (not shown in chart) are Bearish with a score of 27.1 percent.
| SOYBEAN MEAL Futures Statistics | SPECULATORS | COMMERCIALS | SMALL TRADERS |
| – Percent of Open Interest Longs: | 31.1 | 38.4 | 10.9 |
| – Percent of Open Interest Shorts: | 5.2 | 68.3 | 6.8 |
| – Net Position: | 113,102 | -130,796 | 17,694 |
| – Gross Longs: | 135,891 | 167,549 | 47,471 |
| – Gross Shorts: | 22,789 | 298,345 | 29,777 |
| – Long to Short Ratio: | 6.0 to 1 | 0.6 to 1 | 1.6 to 1 |
| NET POSITION TREND: | |||
| – Strength Index Score (3 Year Range Pct): | 66.7 | 34.3 | 27.1 |
| – Strength Index Reading (3 Year Range): | Bullish | Bearish | Bearish |
| NET POSITION MOVEMENT INDEX: | |||
| – 6-Week Change in Strength Index: | -32.8 | 32.0 | 9.7 |
LIVE CATTLE Futures:
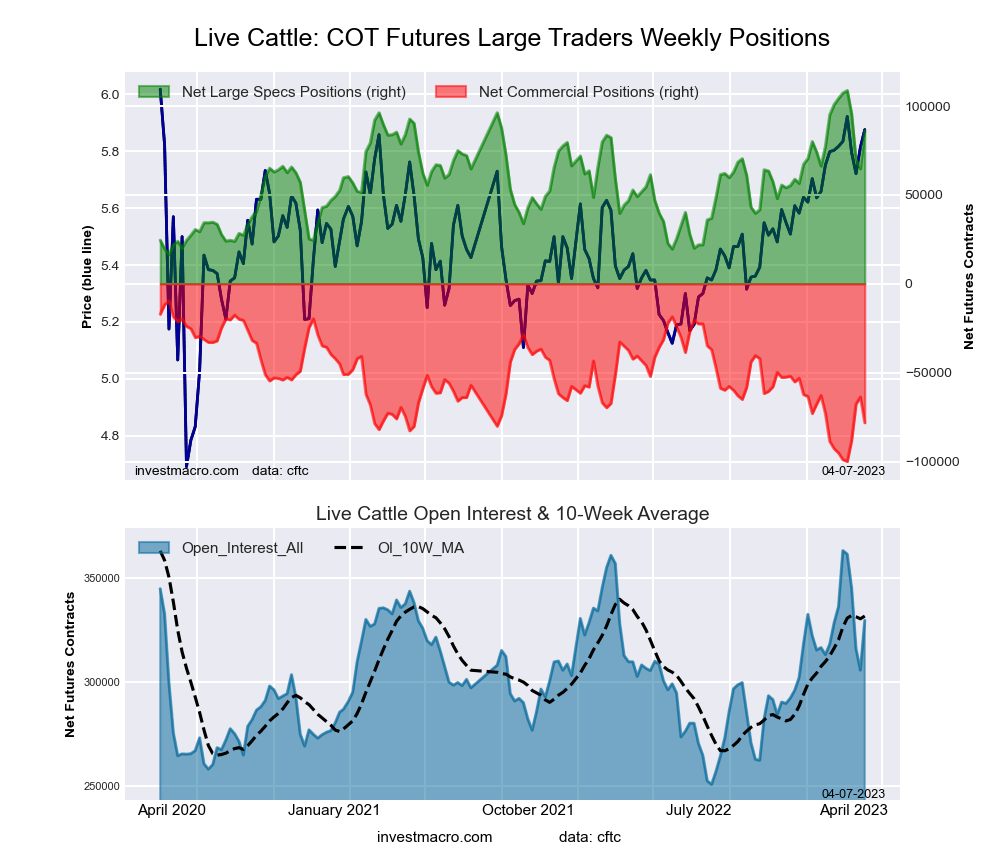
The LIVE CATTLE large speculator standing this week resulted in a net position of 86,174 contracts in the data reported through Tuesday. This was a weekly gain of 21,476 contracts from the previous week which had a total of 64,698 net contracts.
This week’s current strength score (the trader positioning range over the past three years, measured from 0 to 100) shows the speculators are currently Bullish with a score of 74.7 percent. The commercials are Bearish with a score of 26.4 percent and the small traders (not shown in chart) are Bearish with a score of 44.9 percent.
| LIVE CATTLE Futures Statistics | SPECULATORS | COMMERCIALS | SMALL TRADERS |
| – Percent of Open Interest Longs: | 42.5 | 27.1 | 10.5 |
| – Percent of Open Interest Shorts: | 16.3 | 50.8 | 12.9 |
| – Net Position: | 86,174 | -78,189 | -7,985 |
| – Gross Longs: | 139,994 | 89,218 | 34,675 |
| – Gross Shorts: | 53,820 | 167,407 | 42,660 |
| – Long to Short Ratio: | 2.6 to 1 | 0.5 to 1 | 0.8 to 1 |
| NET POSITION TREND: | |||
| – Strength Index Score (3 Year Range Pct): | 74.7 | 26.4 | 44.9 |
| – Strength Index Reading (3 Year Range): | Bullish | Bearish | Bearish |
| NET POSITION MOVEMENT INDEX: | |||
| – 6-Week Change in Strength Index: | -20.3 | 20.6 | 6.1 |
LEAN HOGS Futures:
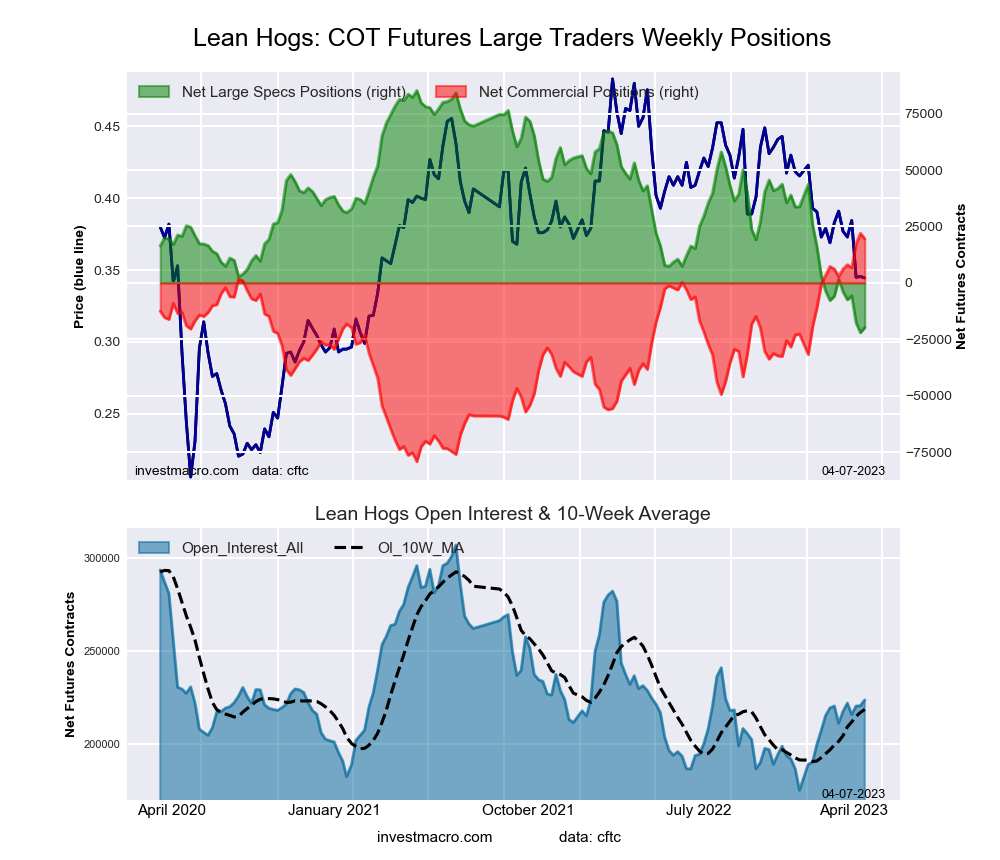
The LEAN HOGS large speculator standing this week resulted in a net position of -19,789 contracts in the data reported through Tuesday. This was a weekly gain of 2,214 contracts from the previous week which had a total of -22,003 net contracts.
This week’s current strength score (the trader positioning range over the past three years, measured from 0 to 100) shows the speculators are currently Bearish-Extreme with a score of 2.1 percent. The commercials are Bullish-Extreme with a score of 97.5 percent and the small traders (not shown in chart) are Bullish-Extreme with a score of 99.0 percent.
| LEAN HOGS Futures Statistics | SPECULATORS | COMMERCIALS | SMALL TRADERS |
| – Percent of Open Interest Longs: | 30.0 | 36.1 | 11.7 |
| – Percent of Open Interest Shorts: | 38.9 | 27.4 | 11.6 |
| – Net Position: | -19,789 | 19,479 | 310 |
| – Gross Longs: | 67,173 | 80,675 | 26,223 |
| – Gross Shorts: | 86,962 | 61,196 | 25,913 |
| – Long to Short Ratio: | 0.8 to 1 | 1.3 to 1 | 1.0 to 1 |
| NET POSITION TREND: | |||
| – Strength Index Score (3 Year Range Pct): | 2.1 | 97.5 | 99.0 |
| – Strength Index Reading (3 Year Range): | Bearish-Extreme | Bullish-Extreme | Bullish-Extreme |
| NET POSITION MOVEMENT INDEX: | |||
| – 6-Week Change in Strength Index: | -20.0 | 16.5 | 25.0 |
COTTON Futures:
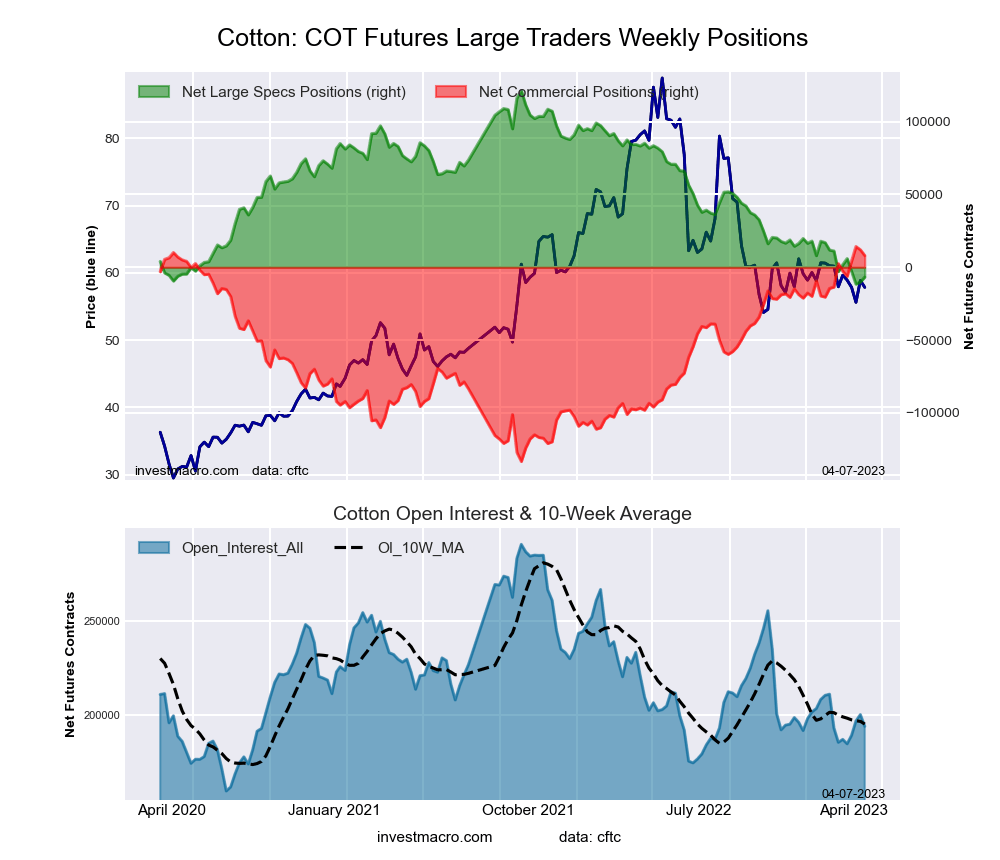
The COTTON large speculator standing this week resulted in a net position of -6,743 contracts in the data reported through Tuesday. This was a weekly increase of 3,378 contracts from the previous week which had a total of -10,121 net contracts.
This week’s current strength score (the trader positioning range over the past three years, measured from 0 to 100) shows the speculators are currently Bearish-Extreme with a score of 3.6 percent. The commercials are Bullish-Extreme with a score of 95.8 percent and the small traders (not shown in chart) are Bearish-Extreme with a score of 8.2 percent.
| COTTON Futures Statistics | SPECULATORS | COMMERCIALS | SMALL TRADERS |
| – Percent of Open Interest Longs: | 25.6 | 49.1 | 5.9 |
| – Percent of Open Interest Shorts: | 29.0 | 45.0 | 6.6 |
| – Net Position: | -6,743 | 8,030 | -1,287 |
| – Gross Longs: | 49,554 | 95,210 | 11,458 |
| – Gross Shorts: | 56,297 | 87,180 | 12,745 |
| – Long to Short Ratio: | 0.9 to 1 | 1.1 to 1 | 0.9 to 1 |
| NET POSITION TREND: | |||
| – Strength Index Score (3 Year Range Pct): | 3.6 | 95.8 | 8.2 |
| – Strength Index Reading (3 Year Range): | Bearish-Extreme | Bullish-Extreme | Bearish-Extreme |
| NET POSITION MOVEMENT INDEX: | |||
| – 6-Week Change in Strength Index: | -2.8 | 3.7 | -10.4 |
COCOA Futures:
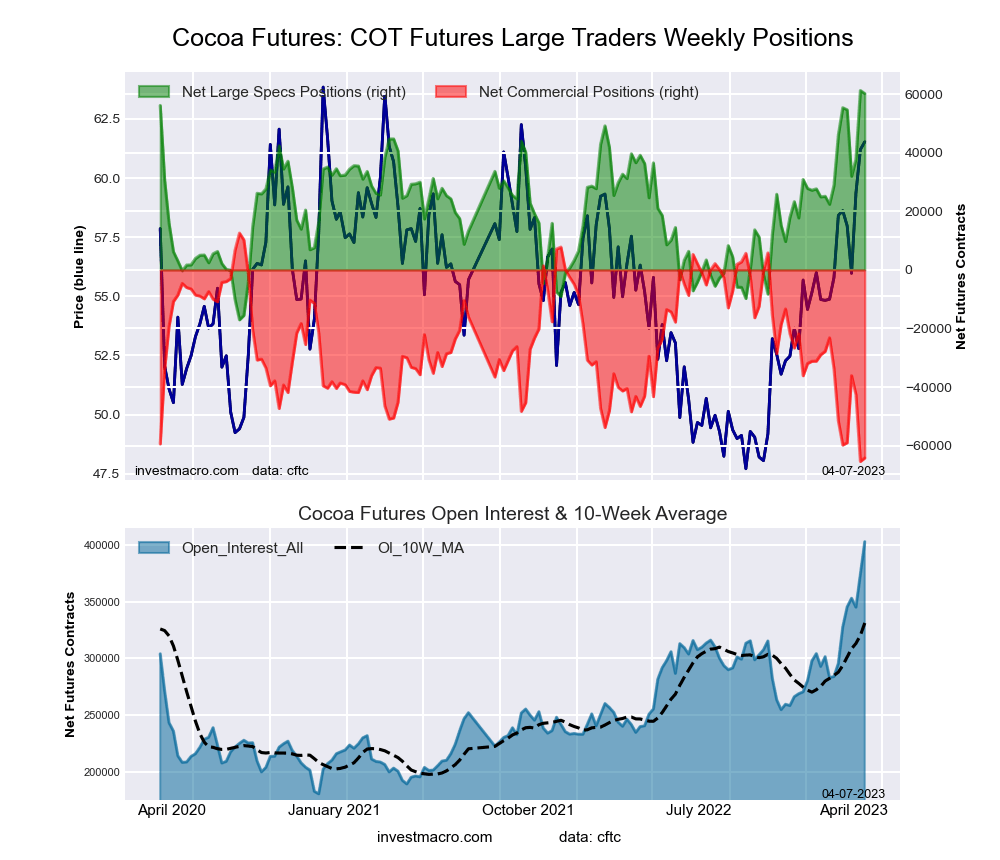
The COCOA large speculator standing this week resulted in a net position of 60,245 contracts in the data reported through Tuesday. This was a weekly fall of -1,028 contracts from the previous week which had a total of 61,273 net contracts.
This week’s current strength score (the trader positioning range over the past three years, measured from 0 to 100) shows the speculators are currently Bullish-Extreme with a score of 98.7 percent. The commercials are Bearish-Extreme with a score of 1.5 percent and the small traders (not shown in chart) are Bearish with a score of 36.4 percent.
| COCOA Futures Statistics | SPECULATORS | COMMERCIALS | SMALL TRADERS |
| – Percent of Open Interest Longs: | 31.5 | 36.4 | 4.0 |
| – Percent of Open Interest Shorts: | 16.6 | 52.3 | 3.0 |
| – Net Position: | 60,245 | -64,227 | 3,982 |
| – Gross Longs: | 127,043 | 146,541 | 16,086 |
| – Gross Shorts: | 66,798 | 210,768 | 12,104 |
| – Long to Short Ratio: | 1.9 to 1 | 0.7 to 1 | 1.3 to 1 |
| NET POSITION TREND: | |||
| – Strength Index Score (3 Year Range Pct): | 98.7 | 1.5 | 36.4 |
| – Strength Index Reading (3 Year Range): | Bullish-Extreme | Bearish-Extreme | Bearish |
| NET POSITION MOVEMENT INDEX: | |||
| – 6-Week Change in Strength Index: | 18.1 | -16.2 | -15.3 |
WHEAT Futures:
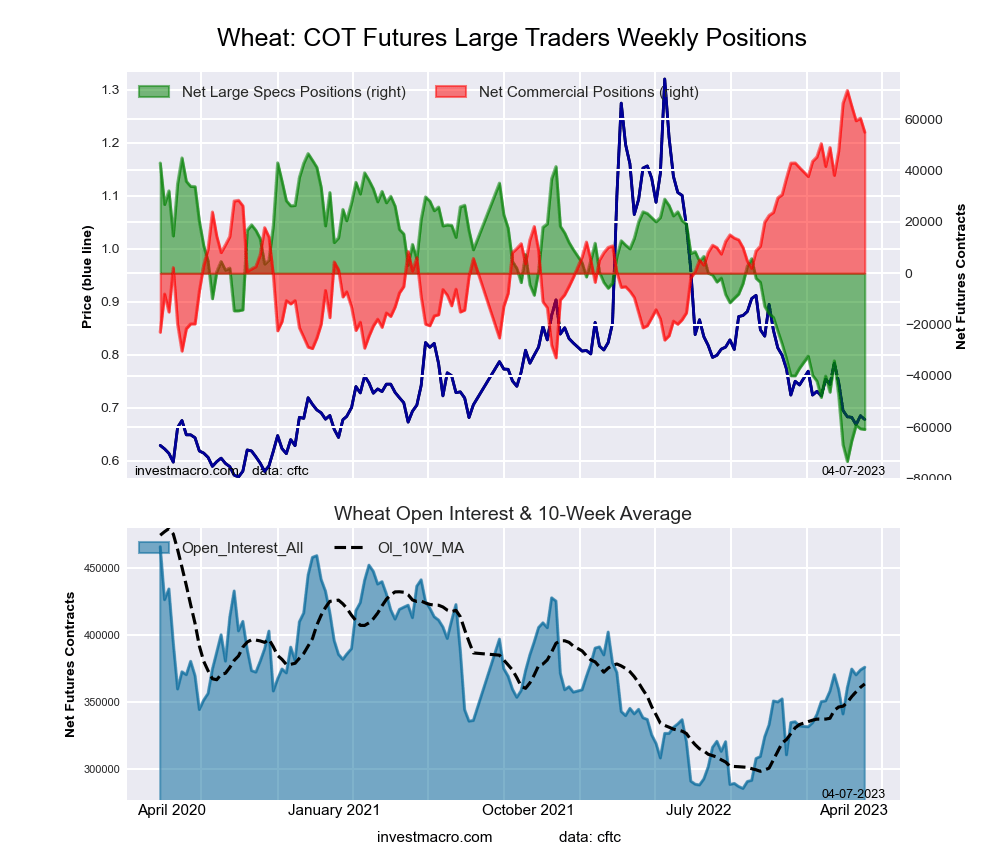
The WHEAT large speculator standing this week resulted in a net position of -60,799 contracts in the data reported through Tuesday. This was a weekly reduction of -254 contracts from the previous week which had a total of -60,545 net contracts.
This week’s current strength score (the trader positioning range over the past three years, measured from 0 to 100) shows the speculators are currently Bearish-Extreme with a score of 10.4 percent. The commercials are Bullish-Extreme with a score of 84.9 percent and the small traders (not shown in chart) are Bullish-Extreme with a score of 100.0 percent.
| WHEAT Futures Statistics | SPECULATORS | COMMERCIALS | SMALL TRADERS |
| – Percent of Open Interest Longs: | 26.4 | 34.3 | 11.3 |
| – Percent of Open Interest Shorts: | 42.6 | 19.7 | 9.8 |
| – Net Position: | -60,799 | 54,864 | 5,935 |
| – Gross Longs: | 99,290 | 129,015 | 42,631 |
| – Gross Shorts: | 160,089 | 74,151 | 36,696 |
| – Long to Short Ratio: | 0.6 to 1 | 1.7 to 1 | 1.2 to 1 |
| NET POSITION TREND: | |||
| – Strength Index Score (3 Year Range Pct): | 10.4 | 84.9 | 100.0 |
| – Strength Index Reading (3 Year Range): | Bearish-Extreme | Bullish-Extreme | Bullish-Extreme |
| NET POSITION MOVEMENT INDEX: | |||
| – 6-Week Change in Strength Index: | -11.1 | 6.8 | 22.1 |
Article By InvestMacro – Receive our weekly COT Newsletter
*COT Report: The COT data, released weekly to the public each Friday, is updated through the most recent Tuesday (data is 3 days old) and shows a quick view of how large speculators or non-commercials (for-profit traders) were positioned in the futures markets.
The CFTC categorizes trader positions according to commercial hedgers (traders who use futures contracts for hedging as part of the business), non-commercials (large traders who speculate to realize trading profits) and nonreportable traders (usually small traders/speculators) as well as their open interest (contracts open in the market at time of reporting). See CFTC criteria here.
More By This Author:
Soft Commodities Speculators Boost Cocoa Bullish Bets To Multi-Year Highs
Currency Speculators Continued To Trim Their Japanese Yen Bearish Positions
Bonds Speculators Raised Their 10-Year Bond Bets To Best Level In 11 Weeks


Comments
Log in or sign up to join the conversation.