
Here are the latest charts and statistics for the Commitment of Traders (COT) data published by the Commodities Futures Trading Commission (CFTC).
The latest COT data is updated through Tuesday August 9th and shows a quick view of how large traders (for-profit speculators and commercial entities) were positioned in the futures markets.
Weekly Speculator Changes
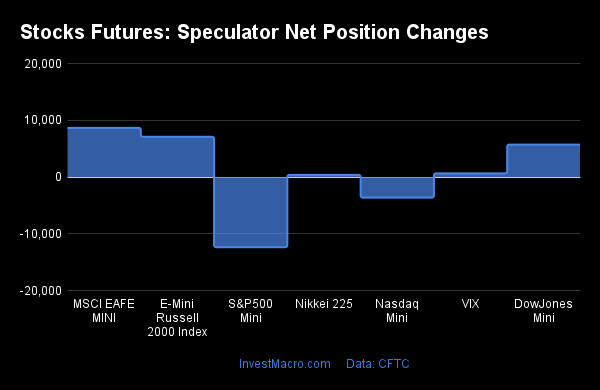
COT stock market speculator bets were mostly higher this week as five out of the seven stock markets we cover had higher positioning this week while two markets had decreasing spec contracts.
Leading the gains for stock markets was the MSCI EAFE Mini (8,666 contracts) and the Russell 2000 Mini (7,087 contracts) with the Dow Jones Mini (5,711 contracts), VIX (643 contracts) and Nikkei 225 USD (375 contracts) also showing positive weeks.
The stock markets leading the declines this week were the S&P500 Mini (-12,376 contracts) and the Nasdaq Mini (-3,637 contracts) with falling speculator bets on the week.
Data Snapshot of Stock Market Traders | Columns Legend
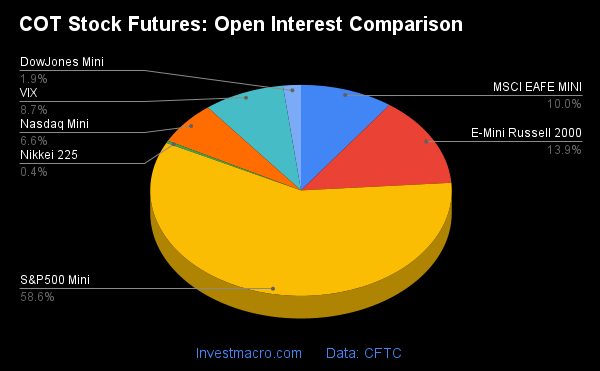
| S&P500-Mini | 2,299,388 | 8 | -244,261 | 11 | 312,241 | 100 | -67,980 | 12 |
| VIX | 341,699 | 39 | -98,195 | 60 | 103,104 | 39 | -4,909 | 68 |
| Nasdaq-Mini | 258,784 | 47 | 21,075 | 87 | -1,167 | 26 | -19,908 | 8 |
| DowJones-Mini | 75,394 | 35 | -12,710 | 21 | 17,168 | 82 | -4,458 | 15 |
| Nikkei 225 Yen | 59,192 | 42 | 7,655 | 58 | 23,075 | 84 | -30,730 | 11 |
| Nikkei 225 | 14,297 | 10 | -4,260 | 57 | 3,462 | 47 | 798 | 38 |
Strength Scores
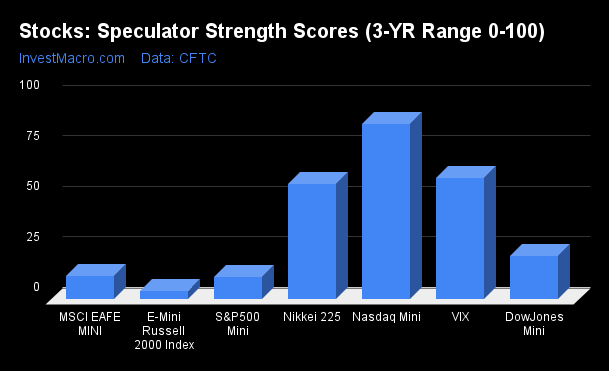
Strength Scores (a normalized measure of Speculator positions over a 3-Year range, from 0 to 100 where above 80 is extreme bullish and below 20 is extreme bearish) show that the Nasdaq-Mini (86.8 percent) continues to lead stocks and remains in a bullish extreme position (above 80 percent). The VIX (60.1 percent) and the Nikkei USD (57.2 percent) come in as the next highest stock markets in strength scores. On the downside, the Russell 2000-Mini (4.0 percent), the S&P500-Mini (10.9 percent) and the EAFE-Mini (11.7 percent) come in as the lowest strength scores currently and are all in bearish extreme speculator levels (below 20 percent).
Strength Statistics:
VIX (60.1 percent) vs VIX previous week (59.8 percent)
S&P500-Mini (10.9 percent) vs S&P500-Mini previous week (13.2 percent)
DowJones-Mini (21.4 percent) vs DowJones-Mini previous week (13.8 percent)
Nasdaq-Mini (86.8 percent) vs Nasdaq-Mini previous week (88.8 percent)
Russell2000-Mini (4.0 percent) vs Russell2000-Mini previous week (0.0 percent)
Nikkei USD (57.2 percent) vs Nikkei USD previous week (55.4 percent)
EAFE-Mini (11.7 percent) vs EAFE-Mini previous week (1.9 percent)
Strength Trends
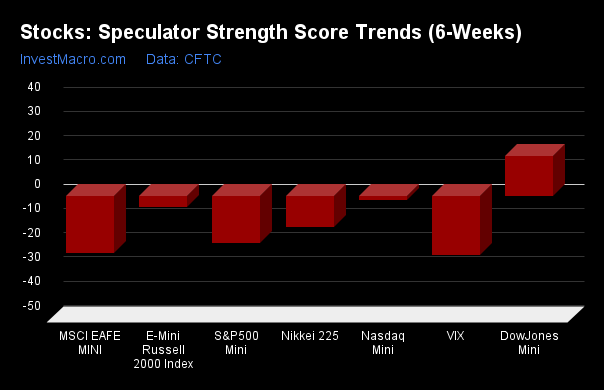
Strength Score Trends (or move index, calculates the 6-week changes in strength scores) show that the DowJones-Mini (16.5 percent) leads the past six weeks trends for stocks and is the only positive mover in the data. The VIX (-24.3 percent), the EAFE-Mini (-23.6 percent) and the S&P500-Mini (-19.5 percent) lead the downside trend scores currently. The data shows that overall, the speculators have had a bearish tilt over that past six weeks.
Strength Trend Statistics:
VIX (-24.3 percent) vs VIX previous week (-24.5 percent)
S&P500-Mini (-19.5 percent) vs S&P500-Mini previous week (-21.8 percent)
DowJones-Mini (16.5 percent) vs DowJones-Mini previous week (9.4 percent)
Nasdaq-Mini (-1.7 percent) vs Nasdaq-Mini previous week (-3.4 percent)
Russell2000-Mini (-4.6 percent) vs Russell2000-Mini previous week (-8.1 percent)
Nikkei USD (-12.6 percent) vs Nikkei USD previous week (-14.5 percent)
EAFE-Mini (-23.6 percent) vs EAFE-Mini previous week (-35.9 percent)
Individual Markets:
VIX Volatility Futures:
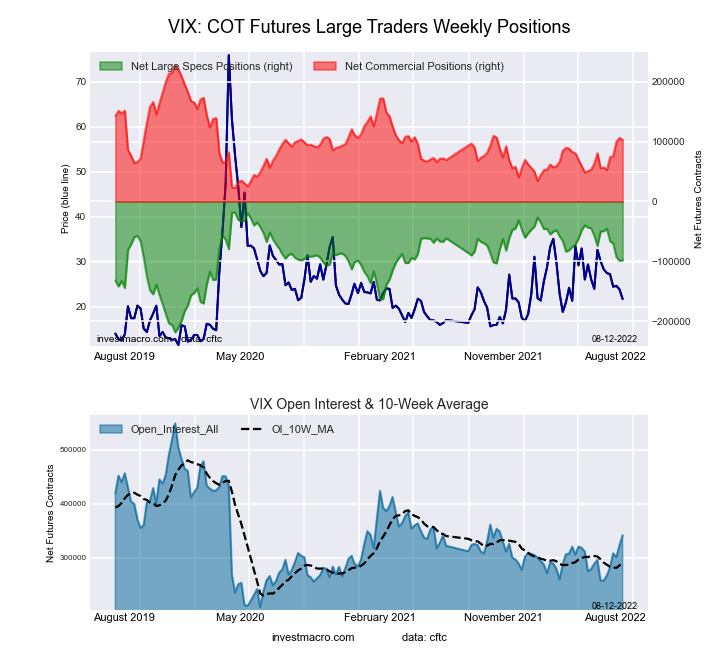
The VIX Volatility large speculator standing this week came in at a net position of -98,195 contracts in the data reported through Tuesday. This was a weekly lift of 643 contracts from the previous week which had a total of -98,838 net contracts.
This week’s current strength score (the trader positioning range over the past three years, measured from 0 to 100) shows the speculators are currently Bullish with a score of 60.1 percent. The commercials are Bearish with a score of 39.3 percent and the small traders (not shown in chart) are Bullish with a score of 67.5 percent.
| VIX Volatility Futures Statistics | SPECULATORS | COMMERCIALS | SMALL TRADERS |
| – Percent of Open Interest Longs: | 12.1 | 60.9 | 7.4 |
| – Percent of Open Interest Shorts: | 40.8 | 30.7 | 8.8 |
| – Net Position: | -98,195 | 103,104 | -4,909 |
| – Gross Longs: | 41,377 | 208,085 | 25,269 |
| – Gross Shorts: | 139,572 | 104,981 | 30,178 |
| – Long to Short Ratio: | 0.3 to 1 | 2.0 to 1 | 0.8 to 1 |
| NET POSITION TREND: | |||
| – Strength Index Score (3 Year Range Pct): | 60.1 | 39.3 | 67.5 |
| – Strength Index Reading (3 Year Range): | Bullish | Bearish | Bullish |
| NET POSITION MOVEMENT INDEX: | |||
| – 6-Week Change in Strength Index: | -24.3 | 22.6 | 11.2 |
S&P500 Mini Futures:
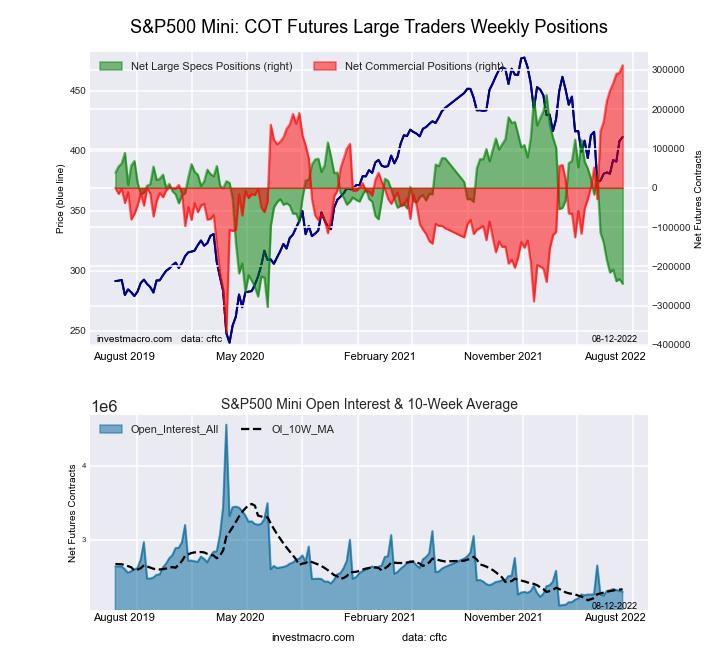
The S&P500 Mini large speculator standing this week came in at a net position of -244,261 contracts in the data reported through Tuesday. This was a weekly lowering of -12,376 contracts from the previous week which had a total of -231,885 net contracts.
This week’s current strength score (the trader positioning range over the past three years, measured from 0 to 100) shows the speculators are currently Bearish-Extreme with a score of 10.9 percent. The commercials are Bullish-Extreme with a score of 100.0 percent and the small traders (not shown in chart) are Bearish-Extreme with a score of 12.1 percent.
| S&P500 Mini Futures Statistics | SPECULATORS | COMMERCIALS | SMALL TRADERS |
| – Percent of Open Interest Longs: | 9.9 | 77.6 | 9.5 |
| – Percent of Open Interest Shorts: | 20.5 | 64.1 | 12.5 |
| – Net Position: | -244,261 | 312,241 | -67,980 |
| – Gross Longs: | 227,064 | 1,785,298 | 218,709 |
| – Gross Shorts: | 471,325 | 1,473,057 | 286,689 |
| – Long to Short Ratio: | 0.5 to 1 | 1.2 to 1 | 0.8 to 1 |
| NET POSITION TREND: | |||
| – Strength Index Score (3 Year Range Pct): | 10.9 | 100.0 | 12.1 |
| – Strength Index Reading (3 Year Range): | Bearish-Extreme | Bullish-Extreme | Bearish-Extreme |
| NET POSITION MOVEMENT INDEX: | |||
| – 6-Week Change in Strength Index: | -19.5 | 21.1 | -8.1 |
Dow Jones Mini Futures:
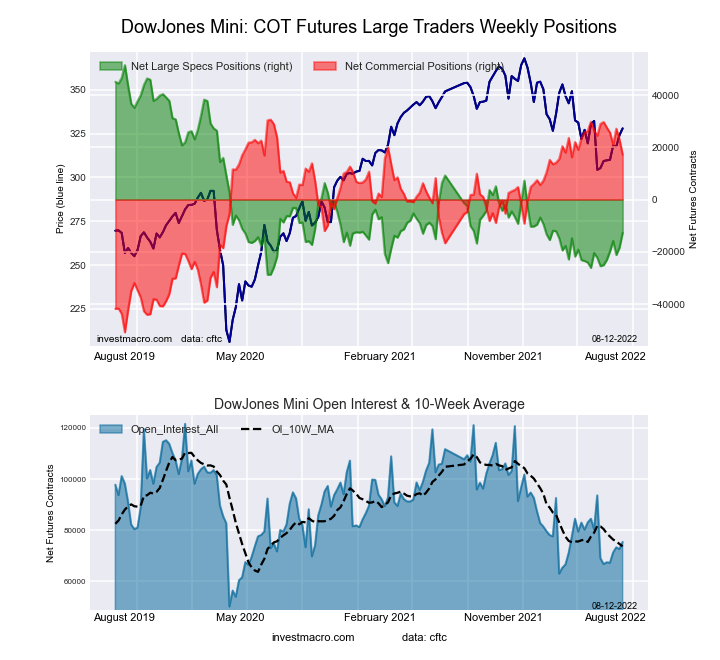
The Dow Jones Mini large speculator standing this week came in at a net position of -12,710 contracts in the data reported through Tuesday. This was a weekly lift of 5,711 contracts from the previous week which had a total of -18,421 net contracts.
This week’s current strength score (the trader positioning range over the past three years, measured from 0 to 100) shows the speculators are currently Bearish with a score of 21.4 percent. The commercials are Bullish-Extreme with a score of 82.0 percent and the small traders (not shown in chart) are Bearish-Extreme with a score of 14.6 percent.
| Dow Jones Mini Futures Statistics | SPECULATORS | COMMERCIALS | SMALL TRADERS |
| – Percent of Open Interest Longs: | 26.5 | 59.1 | 13.7 |
| – Percent of Open Interest Shorts: | 43.4 | 36.3 | 19.7 |
| – Net Position: | -12,710 | 17,168 | -4,458 |
| – Gross Longs: | 20,008 | 44,527 | 10,357 |
| – Gross Shorts: | 32,718 | 27,359 | 14,815 |
| – Long to Short Ratio: | 0.6 to 1 | 1.6 to 1 | 0.7 to 1 |
| NET POSITION TREND: | |||
| – Strength Index Score (3 Year Range Pct): | 21.4 | 82.0 | 14.6 |
| – Strength Index Reading (3 Year Range): | Bearish | Bullish-Extreme | Bearish-Extreme |
| NET POSITION MOVEMENT INDEX: | |||
| – 6-Week Change in Strength Index: | 16.5 | -16.8 | 0.8 |
Nasdaq Mini Futures:
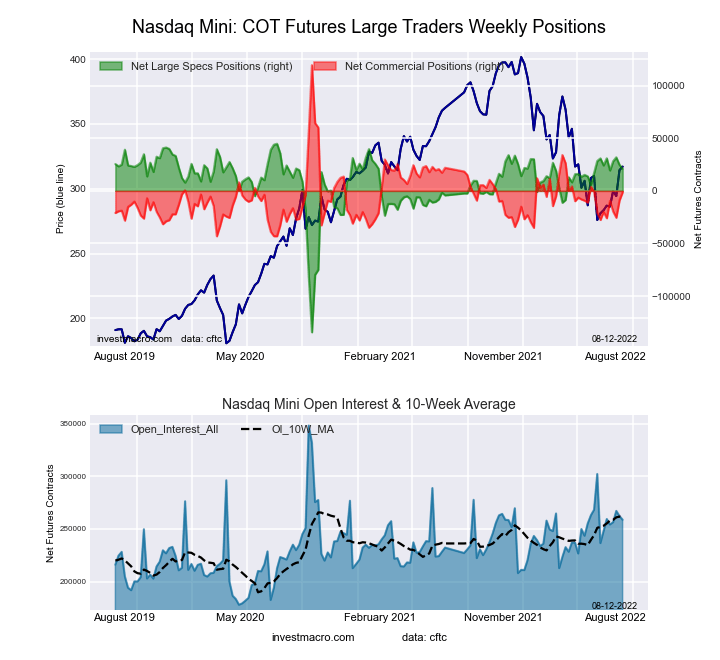
The Nasdaq Mini large speculator standing this week came in at a net position of 21,075 contracts in the data reported through Tuesday. This was a weekly decrease of -3,637 contracts from the previous week which had a total of 24,712 net contracts.
This week’s current strength score (the trader positioning range over the past three years, measured from 0 to 100) shows the speculators are currently Bullish-Extreme with a score of 86.8 percent. The commercials are Bearish with a score of 25.8 percent and the small traders (not shown in chart) are Bearish-Extreme with a score of 7.5 percent.
| Nasdaq Mini Futures Statistics | SPECULATORS | COMMERCIALS | SMALL TRADERS |
| – Percent of Open Interest Longs: | 28.6 | 57.8 | 11.7 |
| – Percent of Open Interest Shorts: | 20.4 | 58.3 | 19.4 |
| – Net Position: | 21,075 | -1,167 | -19,908 |
| – Gross Longs: | 73,939 | 149,705 | 30,221 |
| – Gross Shorts: | 52,864 | 150,872 | 50,129 |
| – Long to Short Ratio: | 1.4 to 1 | 1.0 to 1 | 0.6 to 1 |
| NET POSITION TREND: | |||
| – Strength Index Score (3 Year Range Pct): | 86.8 | 25.8 | 7.5 |
| – Strength Index Reading (3 Year Range): | Bullish-Extreme | Bearish | Bearish-Extreme |
| NET POSITION MOVEMENT INDEX: | |||
| – 6-Week Change in Strength Index: | -1.7 | 11.5 | -32.2 |
Russell 2000 Mini Futures:
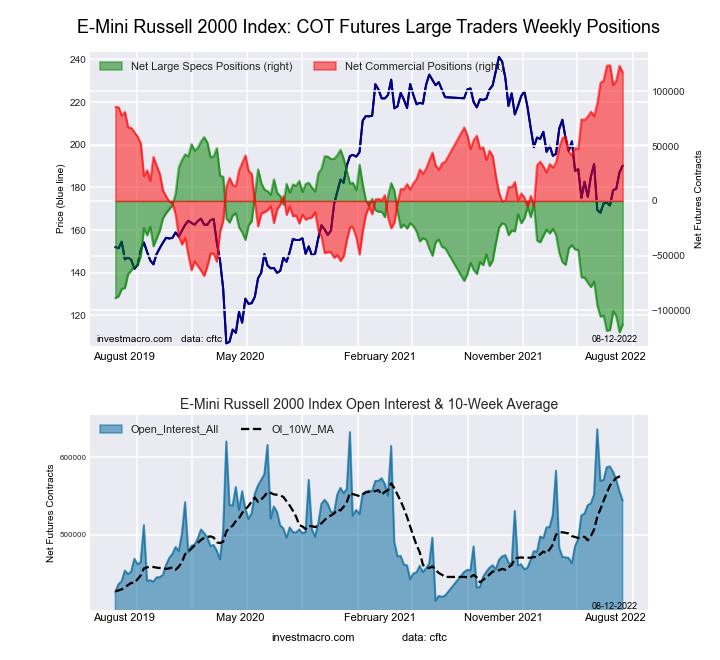
The Russell 2000 Mini large speculator standing this week came in at a net position of -112,867 contracts in the data reported through Tuesday. This was a weekly rise of 7,087 contracts from the previous week which had a total of -119,954 net contracts.
This week’s current strength score (the trader positioning range over the past three years, measured from 0 to 100) shows the speculators are currently Bearish-Extreme with a score of 4.0 percent. The commercials are Bullish-Extreme with a score of 96.6 percent and the small traders (not shown in chart) are Bearish-Extreme with a score of 13.4 percent.
| Russell 2000 Mini Futures Statistics | SPECULATORS | COMMERCIALS | SMALL TRADERS |
| – Percent of Open Interest Longs: | 5.2 | 89.8 | 3.6 |
| – Percent of Open Interest Shorts: | 26.0 | 68.2 | 4.4 |
| – Net Position: | -112,867 | 117,463 | -4,596 |
| – Gross Longs: | 28,422 | 488,823 | 19,479 |
| – Gross Shorts: | 141,289 | 371,360 | 24,075 |
| – Long to Short Ratio: | 0.2 to 1 | 1.3 to 1 | 0.8 to 1 |
| NET POSITION TREND: | |||
| – Strength Index Score (3 Year Range Pct): | 4.0 | 96.6 | 13.4 |
| – Strength Index Reading (3 Year Range): | Bearish-Extreme | Bullish-Extreme | Bearish-Extreme |
| NET POSITION MOVEMENT INDEX: | |||
| – 6-Week Change in Strength Index: | -4.6 | 3.9 | 2.3 |
Nikkei Stock Average (USD) Futures:
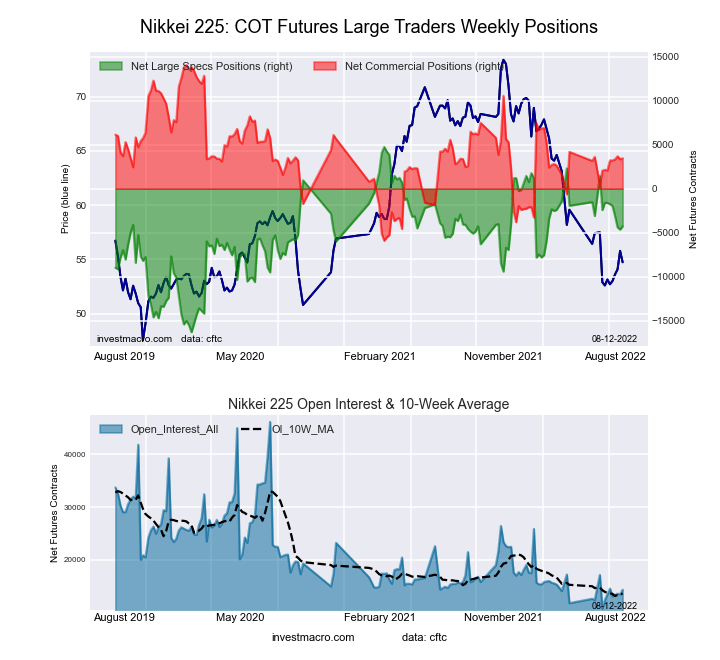
The Nikkei Stock Average (USD) large speculator standing this week came in at a net position of -4,260 contracts in the data reported through Tuesday. This was a weekly lift of 375 contracts from the previous week which had a total of -4,635 net contracts.
This week’s current strength score (the trader positioning range over the past three years, measured from 0 to 100) shows the speculators are currently Bullish with a score of 57.2 percent. The commercials are Bearish with a score of 47.0 percent and the small traders (not shown in chart) are Bearish with a score of 38.3 percent.
| Nikkei Stock Average Futures Statistics | SPECULATORS | COMMERCIALS | SMALL TRADERS |
| – Percent of Open Interest Longs: | 15.9 | 56.1 | 27.4 |
| – Percent of Open Interest Shorts: | 45.7 | 31.9 | 21.9 |
| – Net Position: | -4,260 | 3,462 | 798 |
| – Gross Longs: | 2,278 | 8,017 | 3,922 |
| – Gross Shorts: | 6,538 | 4,555 | 3,124 |
| – Long to Short Ratio: | 0.3 to 1 | 1.8 to 1 | 1.3 to 1 |
| NET POSITION TREND: | |||
| – Strength Index Score (3 Year Range Pct): | 57.2 | 47.0 | 38.3 |
| – Strength Index Reading (3 Year Range): | Bullish | Bearish | Bearish |
| NET POSITION MOVEMENT INDEX: | |||
| – 6-Week Change in Strength Index: | -12.6 | 6.8 | 16.1 |
MSCI EAFE Mini Futures:
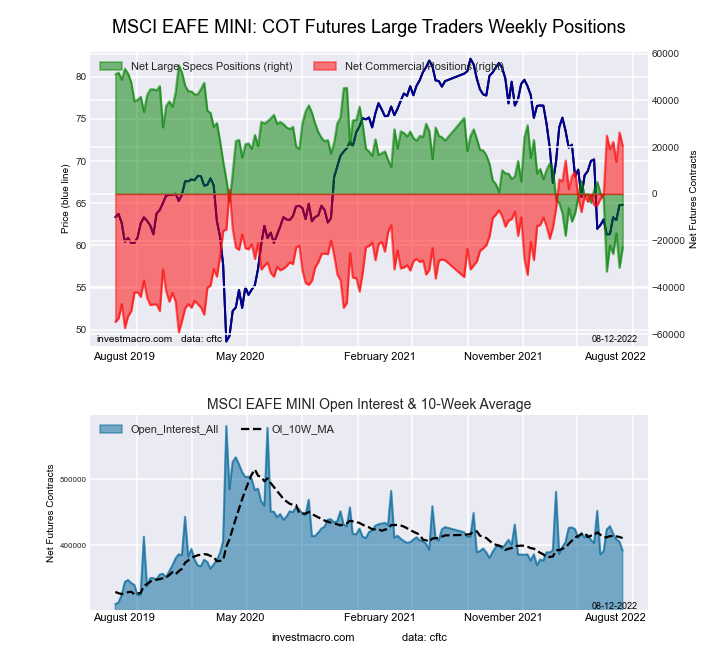
The MSCI EAFE Mini large speculator standing this week came in at a net position of -22,848 contracts in the data reported through Tuesday. This was a weekly lift of 8,666 contracts from the previous week which had a total of -31,514 net contracts.
This week’s current strength score (the trader positioning range over the past three years, measured from 0 to 100) shows the speculators are currently Bearish-Extreme with a score of 11.7 percent. The commercials are Bullish-Extreme with a score of 93.2 percent and the small traders (not shown in chart) are Bearish with a score of 39.4 percent.
| MSCI EAFE Mini Futures Statistics | SPECULATORS | COMMERCIALS | SMALL TRADERS |
| – Percent of Open Interest Longs: | 5.1 | 92.4 | 2.0 |
| – Percent of Open Interest Shorts: | 10.9 | 87.1 | 1.4 |
| – Net Position: | -22,848 | 20,497 | 2,351 |
| – Gross Longs: | 19,817 | 362,255 | 7,872 |
| – Gross Shorts: | 42,665 | 341,758 | 5,521 |
| – Long to Short Ratio: | 0.5 to 1 | 1.1 to 1 | 1.4 to 1 |
| NET POSITION TREND: | |||
| – Strength Index Score (3 Year Range Pct): | 11.7 | 93.2 | 39.4 |
| – Strength Index Reading (3 Year Range): | Bearish-Extreme | Bullish-Extreme | Bearish |
| NET POSITION MOVEMENT INDEX: | |||
| – 6-Week Change in Strength Index: | -23.6 | 24.6 | -1.3 |
More By This Author:
Currency Speculators Trim Japanese Yen Bearish Bets While Brazilian Real Bets Fall To Bearish Level
COT Week 31 Charts: Soft Commodities Speculator Bets Rose Higher This Week Led By Corn & Soybean Oil
Bonds Speculators Bets Drop This Week Led By Fed Funds, Eurodollar & 10-Year Bond


Comments
Log in or sign up to join the conversation.