
SPX: How Stocks React To Mideast Conflicts – And What To Do Now

Image Source: Pexels
Stocks have gone nowhere in the last month. Much of this lackluster performance may be attributed to the Israeli conflict with Iran. So, let’s unpack a Middle East war and market projections playbook for the S&P 500 Index (SPX). While the future is unknown, we’ve come to learn that overreacting often proves costly, suggests Lucas Downey, co-founder at MoneyFlows.
Geopolitical events are never fun to sit through. Whether it’s wars, debt downgrades, tariffs, or rate shocks – uncertainty is unsettling. But should investors hit the sidelines?
A historical look-back at 35 prior geopolitical events proves otherwise. These events include the 1987 stock market crash, Y2K, wars, US debt downgrades, the regional banking crisis, and even the Liberation Day tariff situation.
The S&P 500 tends to show modest, near-term declines, before recovering months later. Here’s how the S&P 500 has performed after major geopolitical events since 1979:
- One-month average declines of -.5%
- Three-month average gains of 1%
- Six-month gains of 5.2%
- 12-month gains of 9.2%
- 24-month returns of 20.3%
Meanwhile, all Middle East conflicts are different. We can’t be completely certain about the outcomes. That said, we can learn a thing or two from history. I took the above geopolitical study and singled out six specific Middle East conflicts including:
- The Second Gulf War (Iraq, March of 2003)
- Israel/Hezbollah War (July of 2006)
- Soleimani Assassination (U.S./Iran, February of 2020)
- Israel/Gaza Conflict (May of 2021)
- Hamas Attacks Israel (October of 2023)
- Iran attacks Israel (April of 2024)
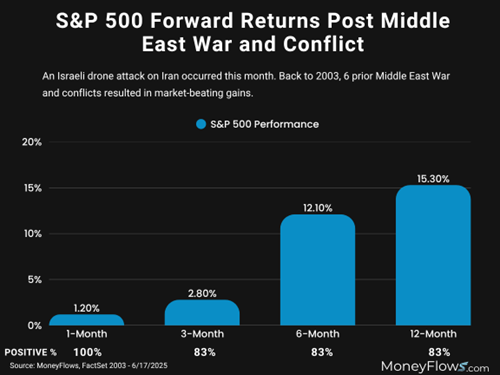
While the following study is limited, note how strong equities tended to perform after these shocks:
- One month later, the S&P 500 gains 1.2%
- Three months later, the S&P 500 jumps 2.8%
- Six months later, the S&P 500 climbs 12.1%
- 12 months later, the S&P 500 climbs 15.3%
Given this evidence-based study, what’s an investor to do? Easy. You don’t want to overreact. You should monitor market conditions with powerful indicators like the 'Big Money Index.' If stocks are a bad bet, such indicators can alert you to a change in money flow trends.
About the Author
Lucas Downey is the co-founder of MAPsignals research, which focuses on finding outlier stocks by following the big money. He is the instructor for options with Investopedia Academy and also posts videos often on his YouTube Channel, www.youtube.com/c/mapsignals.
More By This Author:
USO: Two Things To Consider If You're Using This ETF To Trade Oil
APP: Should You Buy The App Services Stock After Recent Pullback?
ASML & TSM: Why You Should Focus On Chip Manufacturers
Disclosure: © 2024 MoneyShow.com, LLC. All Rights Reserved. Before using this site please read our complete Terms of Service, ...
more

