

Image Source: Unsplash
Here are the latest charts and statistics for the Commitment of Traders (COT) data published by the Commodities Futures Trading Commission (CFTC). The latest COT data is updated through Tuesday, March 22, and shows a quick view of how large traders (for-profit speculators and commercial entities) were positioned in the futures markets.
Highlighting the COT soft commodities data is the continued gains in corn futures bets. The speculative net position in the corn futures has risen for five consecutive weeks, with a total rise of +104,864 contracts over that five-week time-frame. These substantial gains have pushed the current net speculator standing to a total of +519,356 contracts and marks the most bullish level of the past forty-six weeks, dating back to May 4 of 2021.
The corn positioning is near the very top of its three-year range as corn speculator positions hold an extreme bullish strength score at 96.4% this week. The speculator strength score is the current speculator standing compared to past three years where above 80 is bullish extreme and below 20 is bearish extreme.
The soft commodities that saw higher bets this week were corn (12,150 contracts), soybeans (1,037 contracts), live cattle (2,483 contracts), and cotton (4,033 contracts).
The soft commodities that saw declining bets this week were sugar (-784 contracts), coffee (-3,649 contracts), soybean oil (-5,359 contracts), soybean meal (-1,471 contracts), cocoa (-1,487 contracts), lean hogs (-2,505 contracts), and wheat (-1,440 contracts).
Data Snapshot of Commodity Market Traders | Columns Legend
| WTI Crude | 1,788,211 | 0 | 339,969 | 3 | -380,080 | 91 | 40,111 | 72 |
| Corn | 1,526,201 | 25 | 519,356 | 96 | -470,715 | 5 | -48,641 | 15 |
| Natural Gas | 1,085,676 | 1 | -149,337 | 34 | 107,446 | 65 | 41,891 | 85 |
| Sugar | 817,462 | 0 | 155,796 | 69 | -194,333 | 31 | 38,537 | 55 |
| Soybeans | 754,382 | 34 | 218,636 | 84 | -193,646 | 20 | -24,990 | 29 |
| Gold | 605,191 | 48 | 248,032 | 67 | -281,595 | 32 | 33,563 | 59 |
| Heating Oil | 349,618 | 31 | 6,455 | 52 | -32,434 | 37 | 25,979 | 88 |
| Wheat | 345,345 | 5 | 9,490 | 55 | -7,030 | 34 | -2,460 | 100 |
| Coffee | 222,172 | 1 | 41,851 | 79 | -45,824 | 24 | 3,973 | 16 |
| Copper | 197,244 | 24 | 26,812 | 62 | -34,604 | 36 | 7,792 | 70 |
| Brent | 191,138 | 32 | -24,666 | 70 | 22,639 | 31 | 2,027 | 37 |
| Silver | 155,456 | 21 | 47,947 | 70 | -64,557 | 36 | 16,610 | 40 |
| Platinum | 64,000 | 29 | 19,815 | 30 | -27,047 | 70 | 7,232 | 63 |
| Palladium | 6,948 | 2 | -1,208 | 15 | 238 | 78 | 970 | 100 |
Corn Futures:
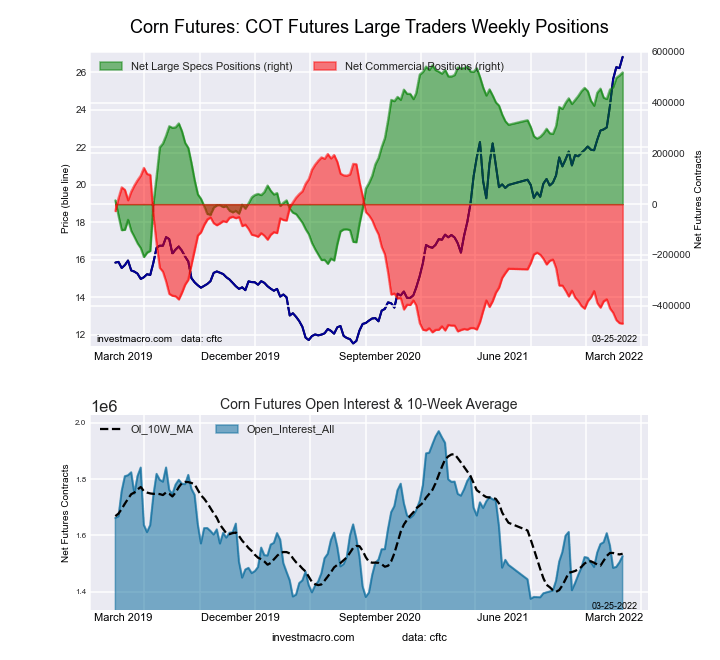
The corn large speculator standing this week reached a net position of 519,356 contracts in the data reported through Tuesday. This was a weekly gain of 12,150 contracts from the previous week, which had a total of 507,206 net contracts.
This week’s current strength score (the trader positioning range over the past three years, measured from 0 to 100) shows the speculators are currently Bullish-Extreme with a score of 96.4%. The commercials are Bearish-Extreme with a score of 4.9%, and the small traders (not shown in chart) are Bearish-Extreme with a score of 15.0%.
| CORN Futures Statistics | SPECULATORS | COMMERCIALS | SMALL TRADERS |
| –% of Open Interest Longs: | 38.2 | 44.3 | 8.9 |
| –% of Open Interest Shorts: | 4.2 | 75.2 | 12.1 |
| – Net Position: | 519,356 | -470,715 | -48,641 |
| – Gross Longs: | 582,844 | 676,718 | 135,850 |
| – Gross Shorts: | 63,488 | 1,147,433 | 184,491 |
| – Long to Short Ratio: | 9.2 to 1 | 0.6 to 1 | 0.7 to 1 |
| NET POSITION TREND: | |||
| – Strength Index Score (3 Year Range Pct): | 96.4 | 4.9 | 15.0 |
| – Strength Index Reading (3 Year Range): | Bullish-Extreme | Bearish-Extreme | Bearish-Extreme |
| NET POSITION MOVEMENT INDEX: | |||
| – 6-Week Change in Strength Index: | 12.7 | -12.5 | -6.8 |
Sugar Futures:
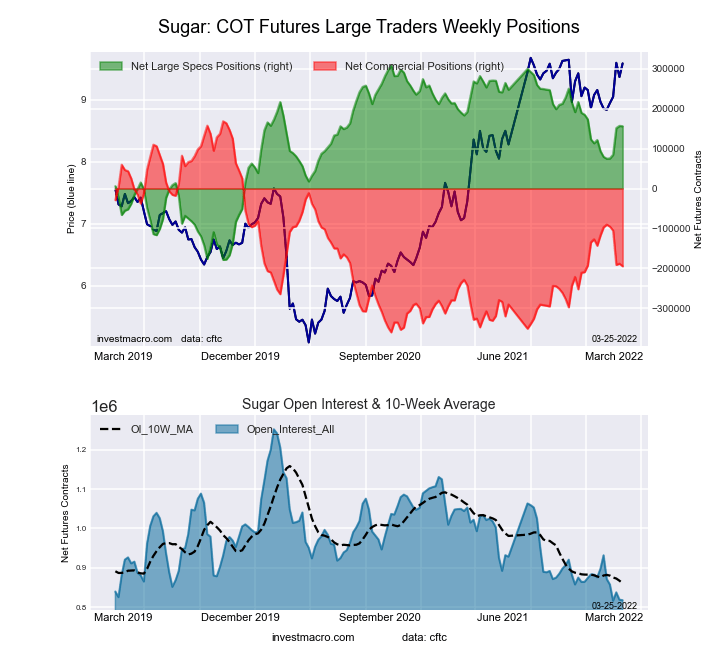
The sugar large speculator standing this week reached a net position of 155,796 contracts in the data reported through Tuesday. This was a weekly fall of -784 contracts from the previous week, which had a total of 156,580 net contracts.
This week’s current strength score (the trader positioning range over the past three years, measured from 0 to 100) shows the speculators are currently Bullish with a score of 68.6%. The commercials are Bearish with a score of 31.3%, and the small traders (not shown in chart) are Bullish with a score of 55.5%.
| SUGAR Futures Statistics | SPECULATORS | COMMERCIALS | SMALL TRADERS |
| –% of Open Interest Longs: | 25.9 | 51.4 | 10.9 |
| –% of Open Interest Shorts: | 6.9 | 75.1 | 6.1 |
| – Net Position: | 155,796 | -194,333 | 38,537 |
| – Gross Longs: | 212,075 | 419,942 | 88,696 |
| – Gross Shorts: | 56,279 | 614,275 | 50,159 |
| – Long to Short Ratio: | 3.8 to 1 | 0.7 to 1 | 1.8 to 1 |
| NET POSITION TREND: | |||
| – Strength Index Score (3 Year Range Pct): | 68.6 | 31.3 | 55.5 |
| – Strength Index Reading (3 Year Range): | Bullish | Bearish | Bullish |
| NET POSITION MOVEMENT INDEX: | |||
| – 6-Week Change in Strength Index: | 15.8 | -18.5 | 25.5 |
Coffee Futures:
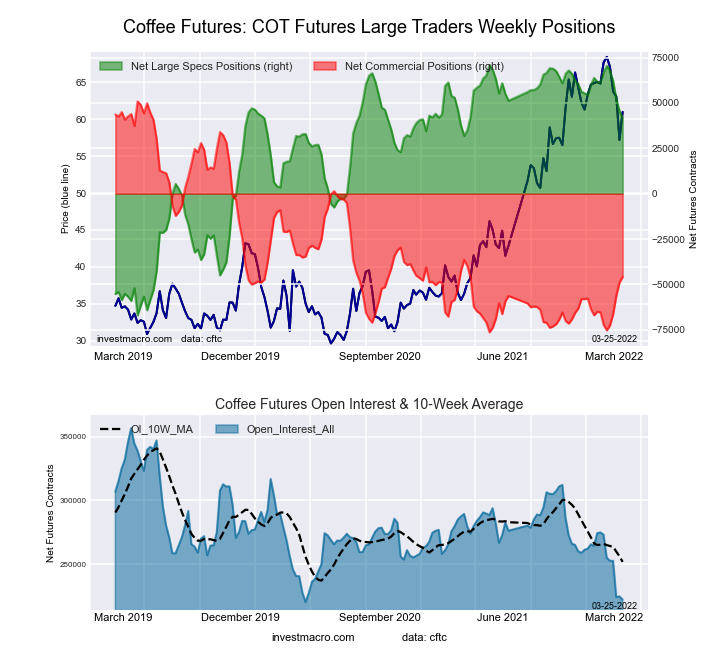
The coffee large speculator standing this week reached a net position of 41,851 contracts in the data reported through Tuesday. This was a weekly lowering of -3,649 contracts from the previous week, which had a total of 45,500 net contracts.
This week’s current strength score (the trader positioning range over the past three years, measured from 0 to 100) shows the speculators are currently Bullish with a score of 79.0%. The commercials are Bearish with a score of 24.0%, and the small traders (not shown in chart) are Bearish-Extreme with a score of 15.8%.
| COFFEE Futures Statistics | SPECULATORS | COMMERCIALS | SMALL TRADERS |
| –% of Open Interest Longs: | 23.9 | 53.2 | 4.6 |
| –% of Open Interest Shorts: | 5.0 | 73.8 | 2.8 |
| – Net Position: | 41,851 | -45,824 | 3,973 |
| – Gross Longs: | 53,000 | 118,138 | 10,190 |
| – Gross Shorts: | 11,149 | 163,962 | 6,217 |
| – Long to Short Ratio: | 4.8 to 1 | 0.7 to 1 | 1.6 to 1 |
| NET POSITION TREND: | |||
| – Strength Index Score (3 Year Range Pct): | 79.0 | 24.0 | 15.8 |
| – Strength Index Reading (3 Year Range): | Bullish | Bearish | Bearish-Extreme |
| NET POSITION MOVEMENT INDEX: | |||
| – 6-Week Change in Strength Index: | -18.2 | 20.8 | -9.8 |
Soybeans Futures:
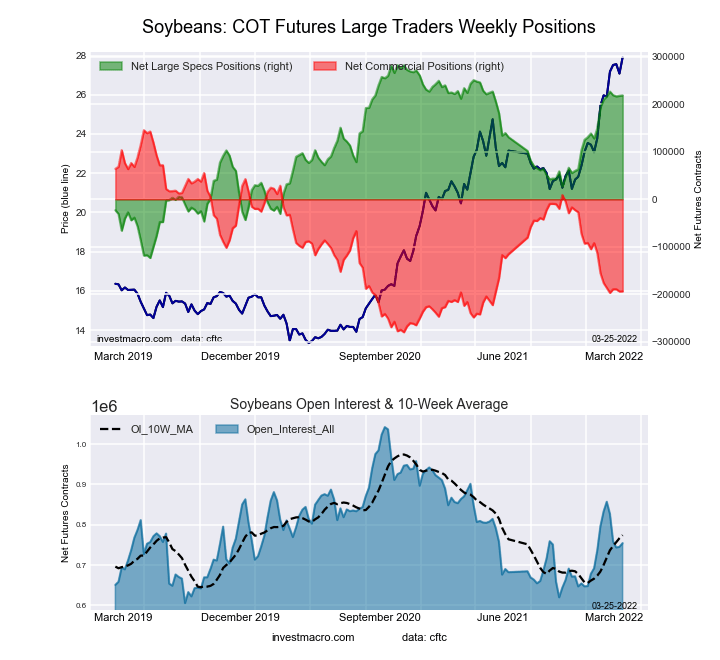
The soybeans large speculator standing this week reached a net position of 218,636 contracts in the data reported through Tuesday. This was a weekly increase of 1,037 contracts from the previous week, which had a total of 217,599 net contracts.
This week’s current strength score (the trader positioning range over the past three years, measured from 0 to 100) shows the speculators are currently Bullish-Extreme with a score of 84.4%. The commercials are Bearish with a score of 20.3%, and the small traders (not shown in chart) are Bearish with a score of 28.8%.
| SOYBEANS Futures Statistics | SPECULATORS | COMMERCIALS | SMALL TRADERS |
| –% of Open Interest Longs: | 35.2 | 44.9 | 7.0 |
| –% of Open Interest Shorts: | 6.2 | 70.6 | 10.4 |
| – Net Position: | 218,636 | -193,646 | -24,990 |
| – Gross Longs: | 265,191 | 338,902 | 53,105 |
| – Gross Shorts: | 46,555 | 532,548 | 78,095 |
| – Long to Short Ratio: | 5.7 to 1 | 0.6 to 1 | 0.7 to 1 |
| NET POSITION TREND: | |||
| – Strength Index Score (3 Year Range Pct): | 84.4 | 20.3 | 28.8 |
| – Strength Index Reading (3 Year Range): | Bullish-Extreme | Bearish | Bearish |
| NET POSITION MOVEMENT INDEX: | |||
| – 6-Week Change in Strength Index: | 2.2 | -4.1 | 14.7 |
Soybean Oil Futures:
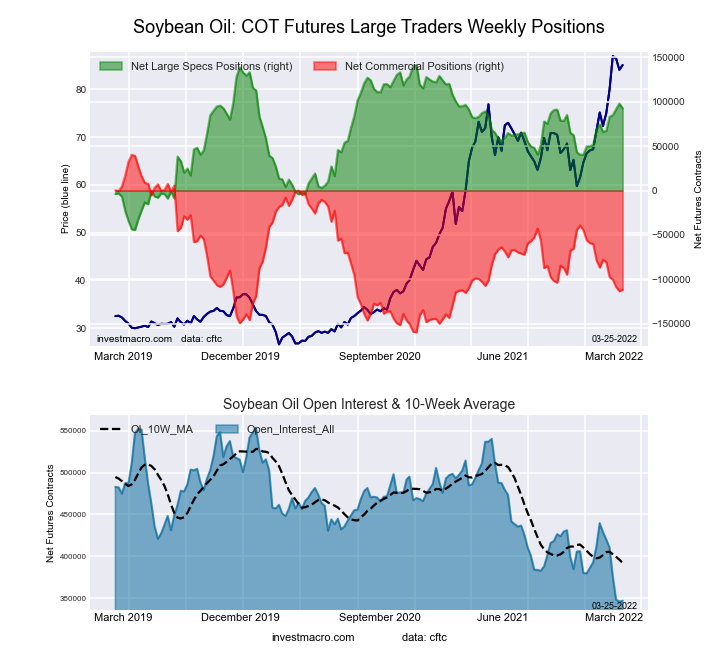
The soybean oil large speculator standing this week reached a net position of 92,568 contracts in the data reported through Tuesday. This was a weekly lowering of -5,359 contracts from the previous week, which had a total of 97,927 net contracts.
This week’s current strength score (the trader positioning range over the past three years, measured from 0 to 100) shows the speculators are currently Bullish with a score of 73.8%. The commercials are Bearish with a score of 24.0%, and the small traders (not shown in chart) are Bullish-Extreme with a score of 84.1%.
| SOYBEAN OIL Futures Statistics | SPECULATORS | COMMERCIALS | SMALL TRADERS |
| –% of Open Interest Longs: | 31.7 | 48.9 | 10.3 |
| –% of Open Interest Shorts: | 5.0 | 81.0 | 4.8 |
| – Net Position: | 92,568 | -111,498 | 18,930 |
| – Gross Longs: | 110,061 | 169,898 | 35,595 |
| – Gross Shorts: | 17,493 | 281,396 | 16,665 |
| – Long to Short Ratio: | 6.3 to 1 | 0.6 to 1 | 2.1 to 1 |
| NET POSITION TREND: | |||
| – Strength Index Score (3 Year Range Pct): | 73.8 | 24.0 | 84.1 |
| – Strength Index Reading (3 Year Range): | Bullish | Bearish | Bullish-Extreme |
| NET POSITION MOVEMENT INDEX: | |||
| – 6-Week Change in Strength Index: | 14.3 | -16.9 | 26.9 |
Soybean Meal Futures:
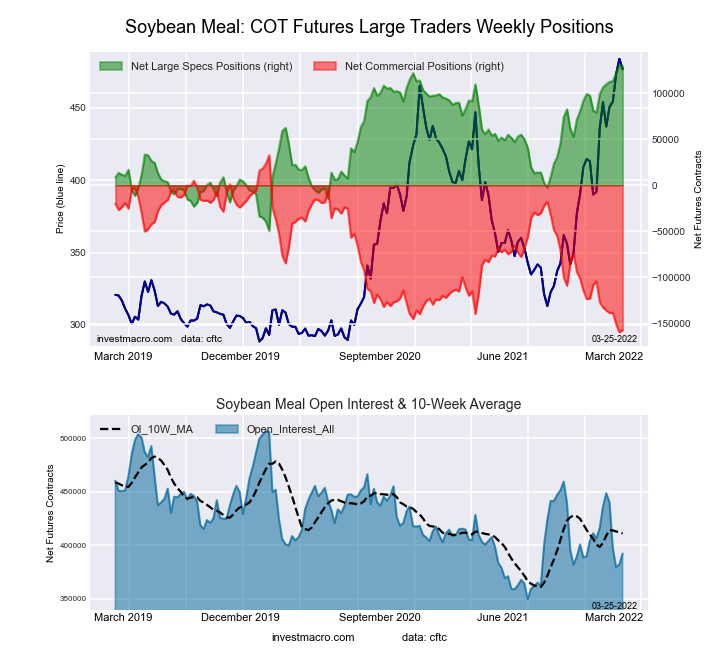
The soybean meal large speculator standing this week reached a net position of 128,784 contracts in the data reported through Tuesday. This was a weekly decline of -1,471 contracts from the previous week, which had a total of 130,255 net contracts.
This week’s current strength score (the trader positioning range over the past three years, measured from 0 to 100) shows the speculators are currently Bullish-Extreme with a score of 99.2%. The commercials are Bearish-Extreme with a score of 1.3%, and the small traders (not shown in chart) are Bullish-Extreme with a score of 83.1%.
| SOYBEAN MEAL Futures Statistics | SPECULATORS | COMMERCIALS | SMALL TRADERS |
| –% of Open Interest Longs: | 35.9 | 41.7 | 11.9 |
| –% of Open Interest Shorts: | 3.1 | 81.8 | 4.7 |
| – Net Position: | 128,784 | -157,051 | 28,267 |
| – Gross Longs: | 140,982 | 163,690 | 46,858 |
| – Gross Shorts: | 12,198 | 320,741 | 18,591 |
| – Long to Short Ratio: | 11.6 to 1 | 0.5 to 1 | 2.5 to 1 |
| NET POSITION TREND: | |||
| – Strength Index Score (3 Year Range Pct): | 99.2 | 1.3 | 83.1 |
| – Strength Index Reading (3 Year Range): | Bullish-Extreme | Bearish-Extreme | Bullish-Extreme |
| NET POSITION MOVEMENT INDEX: | |||
| – 6-Week Change in Strength Index: | 12.5 | -12.8 | 8.4 |
Live Cattle Futures:
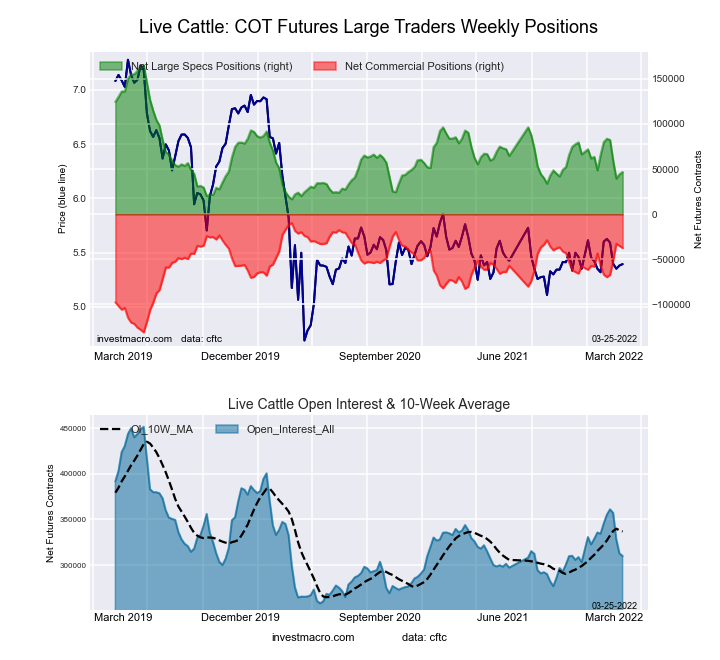
The live cattle large speculator standing this week reached a net position of 46,739 contracts in the data reported through Tuesday. This was a weekly rise of 2,483 contracts from the previous week, which had a total of 44,256 net contracts.
This week’s current strength score (the trader positioning range over the past three years, measured from 0 to 100) shows the speculators are currently Bearish with a score of 20.4%. The commercials are Bullish with a score of 77.1%, and the small traders (not shown in chart) are Bullish with a score of 64.5%.
| LIVE CATTLE Futures Statistics | SPECULATORS | COMMERCIALS | SMALL TRADERS |
| –% of Open Interest Longs: | 35.2 | 41.8 | 10.6 |
| –% of Open Interest Shorts: | 20.1 | 53.9 | 13.6 |
| – Net Position: | 46,739 | -37,444 | -9,295 |
| – Gross Longs: | 108,953 | 129,408 | 32,699 |
| – Gross Shorts: | 62,214 | 166,852 | 41,994 |
| – Long to Short Ratio: | 1.8 to 1 | 0.8 to 1 | 0.8 to 1 |
| NET POSITION TREND: | |||
| – Strength Index Score (3 Year Range Pct): | 20.4 | 77.1 | 64.5 |
| – Strength Index Reading (3 Year Range): | Bearish | Bullish | Bullish |
| NET POSITION MOVEMENT INDEX: | |||
| – 6-Week Change in Strength Index: | -22.2 | 24.3 | 8.8 |
Lean Hogs Futures:
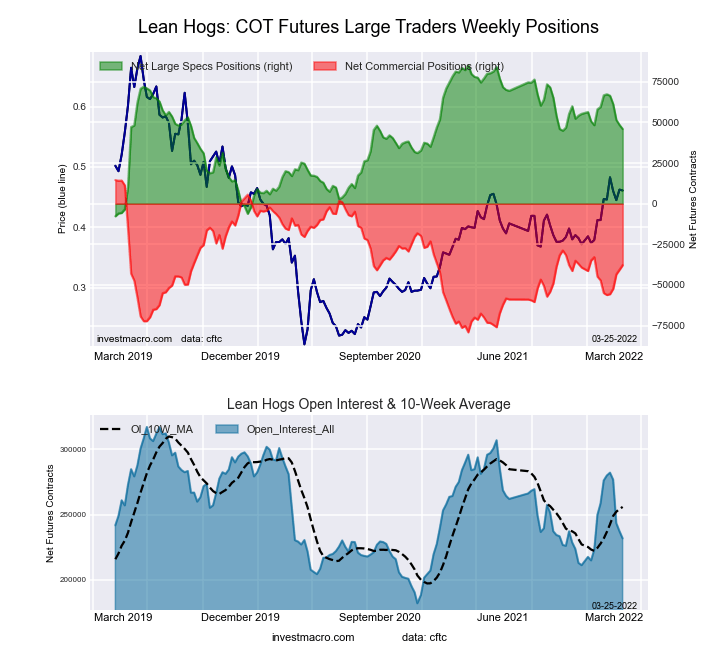
The lean hogs large speculator standing this week reached a net position of 45,985 contracts in the data reported through Tuesday. This was a weekly fall of -2,505 contracts from the previous week, which had a total of 48,490 net contracts.
This week’s current strength score (the trader positioning range over the past three years, measured from 0 to 100) shows the speculators are currently Bullish with a score of 56.8%. The commercials are Bearish with a score of 48.8%, and the small traders (not shown in chart) are Bullish with a score of 52.6%.
| LEAN HOGS Futures Statistics | SPECULATORS | COMMERCIALS | SMALL TRADERS |
| –% of Open Interest Longs: | 37.3 | 35.9 | 9.8 |
| –% of Open Interest Shorts: | 17.5 | 52.3 | 13.3 |
| – Net Position: | 45,985 | -37,830 | -8,155 |
| – Gross Longs: | 86,563 | 83,339 | 22,630 |
| – Gross Shorts: | 40,578 | 121,169 | 30,785 |
| – Long to Short Ratio: | 2.1 to 1 | 0.7 to 1 | 0.7 to 1 |
| NET POSITION TREND: | |||
| – Strength Index Score (3 Year Range Pct): | 56.8 | 48.8 | 52.6 |
| – Strength Index Reading (3 Year Range): | Bullish | Bearish | Bullish |
| NET POSITION MOVEMENT INDEX: | |||
| – 6-Week Change in Strength Index: | -22.5 | 20.3 | 17.7 |
Cotton Futures:
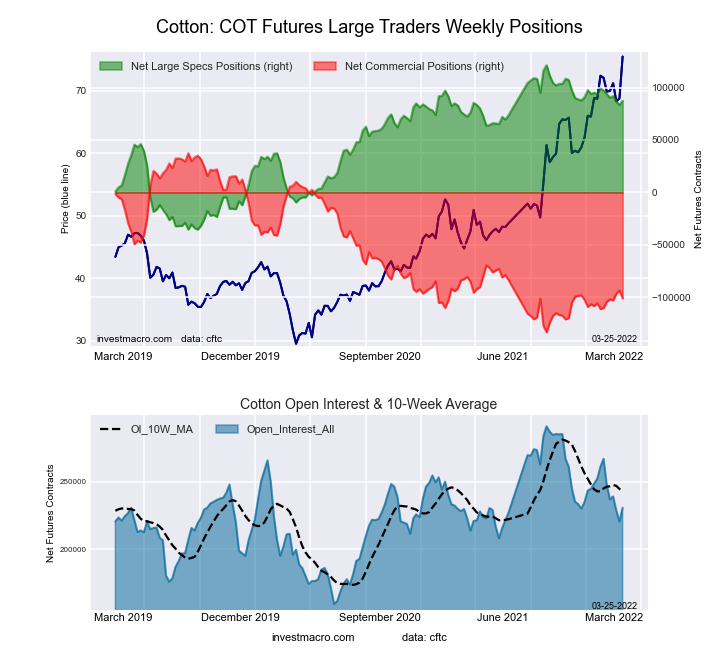
The cotton large speculator standing this week reached a net position of 87,354 contracts in the data reported through Tuesday. This was a weekly boost of 4,033 contracts from the previous week, which had a total of 83,321 net contracts.
This week’s current strength score (the trader positioning range over the past three years, measured from 0 to 100) shows the speculators are currently Bullish with a score of 78.3%. The commercials are Bearish-Extreme with a score of 18.9%, and the small traders (not shown in chart) are Bullish-Extreme with a score of 98.8%.
| COTTON Futures Statistics | SPECULATORS | COMMERCIALS | SMALL TRADERS |
| –% of Open Interest Longs: | 43.7 | 37.3 | 9.1 |
| –% of Open Interest Shorts: | 5.8 | 81.1 | 3.2 |
| – Net Position: | 87,354 | -101,015 | 13,661 |
| – Gross Longs: | 100,659 | 85,918 | 20,968 |
| – Gross Shorts: | 13,305 | 186,933 | 7,307 |
| – Long to Short Ratio: | 7.6 to 1 | 0.5 to 1 | 2.9 to 1 |
| NET POSITION TREND: | |||
| – Strength Index Score (3 Year Range Pct): | 78.3 | 18.9 | 98.8 |
| – Strength Index Reading (3 Year Range): | Bullish | Bearish-Extreme | Bullish-Extreme |
| NET POSITION MOVEMENT INDEX: | |||
| – 6-Week Change in Strength Index: | -6.3 | 5.3 | 4.7 |
Cocoa Futures:
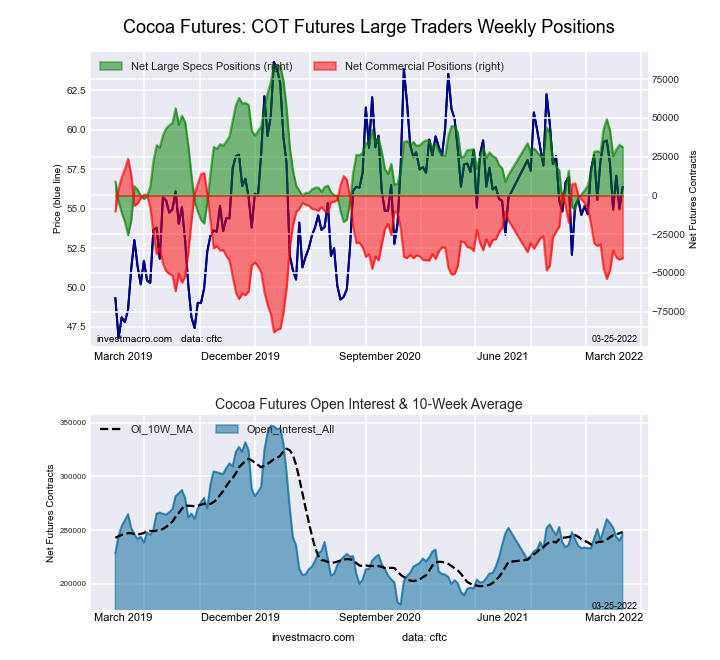
The cocoa large speculator standing this week reached a net position of 31,204 contracts in the data reported through Tuesday. This was a weekly decrease of -1,487 contracts from the previous week, which had a total of 32,691 net contracts.
This week’s current strength score (the trader positioning range over the past three years, measured from 0 to 100) shows the speculators are currently Bearish with a score of 48.2%. The commercials are Bearish with a score of 46.5%, and the small traders (not shown in chart) are Bullish-Extreme with a score of 90.3%.
| COCOA Futures Statistics | SPECULATORS | COMMERCIALS | SMALL TRADERS |
| –% of Open Interest Longs: | 29.6 | 47.3 | 7.1 |
| –% of Open Interest Shorts: | 16.9 | 63.8 | 3.3 |
| – Net Position: | 31,204 | -40,535 | 9,331 |
| – Gross Longs: | 72,893 | 116,511 | 17,572 |
| – Gross Shorts: | 41,689 | 157,046 | 8,241 |
| – Long to Short Ratio: | 1.7 to 1 | 0.7 to 1 | 2.1 to 1 |
| NET POSITION TREND: | |||
| – Strength Index Score (3 Year Range Pct): | 48.2 | 46.5 | 90.3 |
| – Strength Index Reading (3 Year Range): | Bearish | Bearish | Bullish-Extreme |
| NET POSITION MOVEMENT INDEX: | |||
| – 6-Week Change in Strength Index: | -11.4 | 6.5 | 48.2 |
Wheat Futures:
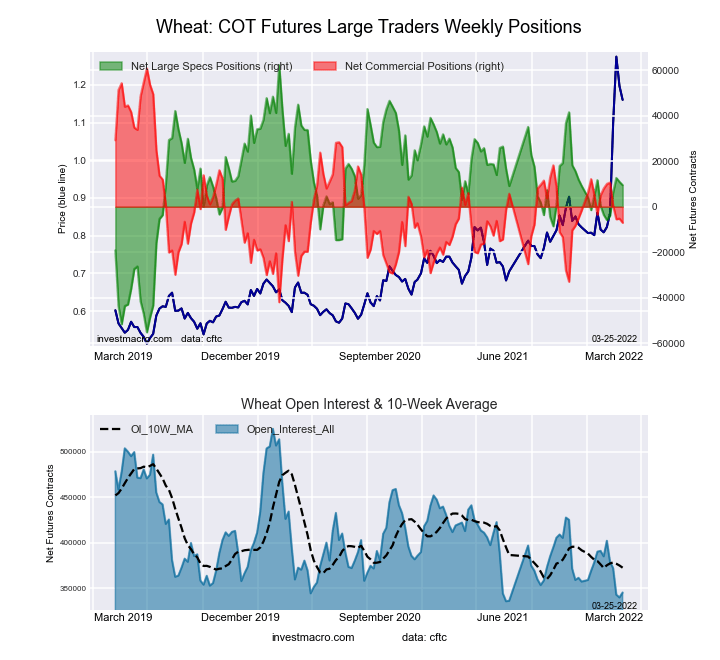
The wheat large speculator standing this week reached a net position of 9,490 contracts in the data reported through Tuesday. This was a weekly reduction of -1,440 contracts from the previous week, which had a total of 10,930 net contracts.
This week’s current strength score (the trader positioning range over the past three years, measured from 0 to 100) shows the speculators are currently Bullish with a score of 55.1%. The commercials are Bearish with a score of 34.0%, and the small traders (not shown in chart) are Bullish-Extreme with a score of 100.0%.
| WHEAT Futures Statistics | SPECULATORS | COMMERCIALS | SMALL TRADERS |
| –% of Open Interest Longs: | 32.8 | 42.0 | 9.4 |
| –% of Open Interest Shorts: | 30.1 | 44.1 | 10.1 |
| – Net Position: | 9,490 | -7,030 | -2,460 |
| – Gross Longs: | 113,410 | 145,144 | 32,492 |
| – Gross Shorts: | 103,920 | 152,174 | 34,952 |
| – Long to Short Ratio: | 1.1 to 1 | 1.0 to 1 | 0.9 to 1 |
| NET POSITION TREND: | |||
| – Strength Index Score (3 Year Range Pct): | 55.1 | 34.0 | 100.0 |
| – Strength Index Reading (3 Year Range): | Bullish | Bearish | Bullish-Extreme |
| NET POSITION MOVEMENT INDEX: | |||
| – 6-Week Change in Strength Index: | 11.1 | -14.6 | 10.3 |
Article By InvestMacro – Receive our weekly COT Reports by Email
*COT Report: The COT data, released weekly to the public each Friday, is updated through the most recent Tuesday (data is three days old) and shows a quick view of how large speculators or non-commercials (for-profit traders) were positioned in the futures markets.
The CFTC categorizes trader positions according to commercial hedgers (traders who use futures contracts for hedging as part of the business), non-commercials (large traders who speculate to realize trading profits), and nonreportable traders (usually small traders/speculators), as well as their open interest (contracts open in the market at time of reporting). See CFTC criteria here.


Comments
Log in or sign up to join the conversation.