
Soft Commodities Speculators Boost Cocoa Bullish Bets To Multi-Year Highs
Here are the latest charts and statistics for the Commitment of Traders (COT) reports data published by the Commodities Futures Trading Commission (CFTC).
The latest COT data is updated through Tuesday March 28th and shows a quick view of how large traders (for-profit speculators and commercial entities) were positioned in the futures markets.
Weekly Speculator Changes led by Cocoa & Sugar
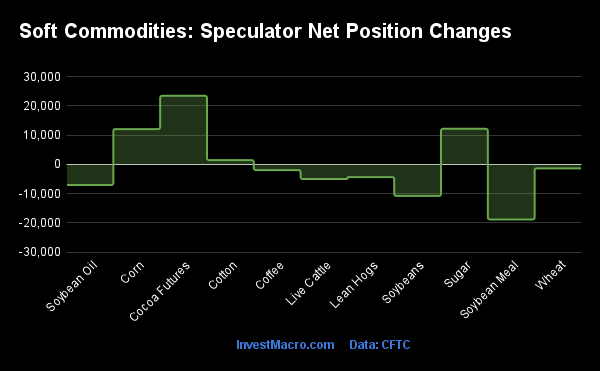
The COT soft commodities markets speculator bets were lower this week as four out of the eleven softs markets we cover had higher positioning while the other seven markets had lower speculator contracts.
Leading the gains for the softs markets was Cocoa (23,427 contracts) with Sugar (12,173 contracts), Corn (12,052 contracts), Cotton (1,461 contracts), Soybean Oil (-7,041 contracts) and Live Cattle (-5,002 contracts) also showing positive weeks.
The markets with the declines in speculator bets this week were Soybean Meal (-18,802 contracts) with Soybeans (-10,767 contracts), Lean Hogs (-4,350 contracts), Coffee (-1,945 contracts) and Wheat (-1,342 contracts) also registering lower bets on the week.
Cocoa speculator bets and futures prices hit multi-year highs
Highlighting the COT soft commodities data this week is the continued rise in the Cocoa speculator’s bullish positioning. The large speculator bets for Cocoa rose this week by over +20,000 contracts and have gained for two straight weeks as well as for five out of the past seven weeks (total 7-week rise of +38,842 contracts). The Cocoa net positions has now advanced to the highest net speculator position level of the past 160 weeks, dating back to March 3rd of 2020 when positions totaled +73,970 net contracts.
Cocoa’s speculator strength score level is at the top of its 3-year range at 100 percent while its strength score trend (6-weeks) has jumped by 41 percent and illustrates its recent speculator sentiment strength.
The Cocoa futures price has been on a strong bullish run since hitting a bottom in September of 2022. This week marked a third straight week of gains and Cocoa futures touched their highest level since 2017 at over the 2960 threshold.
|
Mar-28-2023
|
OI
|
OI-Index
|
Spec-Net
|
Spec-Index
|
Com-Net
|
COM-Index
|
Smalls-Net
|
Smalls-Index
|
|---|---|---|---|---|---|---|---|---|
| WTI Crude | 1,785,807 | 35 | 181,069 | 6 | -191,616 | 97 | 10,547 | 16 |
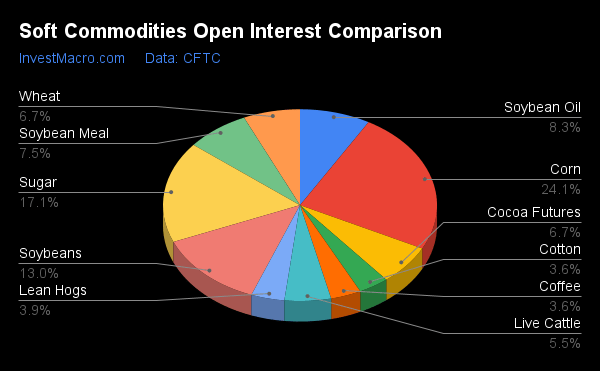
| Corn | 1,345,886 | 20 | 71,528 | 39 | -12,518 | 70 | -59,010 | 18 |
| Natural Gas | 1,279,180 | 64 | -126,197 | 22 | 95,382 | 78 | 30,815 | 53 |
| Sugar | 953,477 | 60 | 222,829 | 71 | -275,157 | 24 | 52,328 | 73 |
| Soybeans | 723,433 | 32 | 161,020 | 52 | -129,321 | 52 | -31,699 | 19 |
| Gold | 478,611 | 26 | 181,630 | 57 | -201,508 | 46 | 19,878 | 30 |
| Wheat | 373,926 | 51 | -60,545 | 11 | 60,324 | 90 | 221 | 92 |
| Heating Oil | 271,542 | 25 | 9,263 | 44 | -26,976 | 56 | 17,713 | 60 |
| Copper | 211,889 | 52 | -1,545 | 27 | -4,924 | 69 | 6,469 | 59 |
| Coffee | 200,894 | 13 | 16,751 | 45 | -15,709 | 60 | -1,042 | 0 |
| Brent | 159,742 | 21 | -52,506 | 0 | 48,569 | 100 | 3,937 | 62 |
| Silver | 117,395 | 0 | 13,361 | 37 | -21,875 | 67 | 8,514 | 14 |
| Platinum | 57,244 | 32 | 10,374 | 40 | -14,781 | 63 | 4,407 | 27 |
| Palladium | 11,514 | 78 | -6,764 | 3 | 7,193 | 98 | -429 | 16 |
Strength Scores led by Cocoa & Sugar
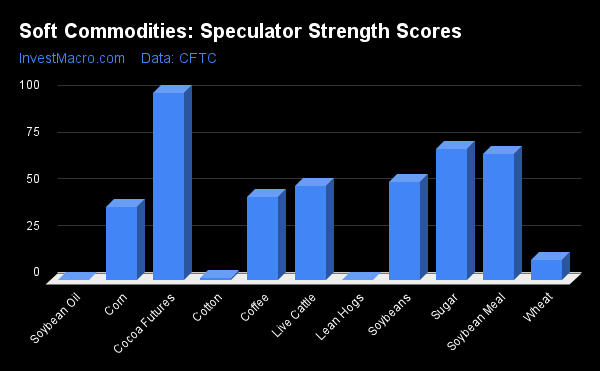
COT Strength Scores (a normalized measure of Speculator positions over a 3-Year range, from 0 to 100 where above 80 is Extreme-Bullish and below 20 is Extreme-Bearish) showed that Cocoa (100 percent) and Sugar (71 percent) lead the softs markets this week. Soybean Meal (67 percent), Soybeans (52 percent) and Live Cattle (51 percent) come in as the next highest in the weekly strength scores.
On the downside, Lean Hogs (0 percent), Soybean Oil (0 percent), Cotton (1 percent) and Wheat (11 percent) came in at the lowest strength levels currently and are in Extreme-Bearish territory (below 20 percent).
Strength Statistics:
Corn (39.2 percent) vs Corn previous week (37.6 percent)
Sugar (70.5 percent) vs Sugar previous week (66.3 percent)
Coffee (44.6 percent) vs Coffee previous week (46.6 percent)
Soybeans (52.4 percent) vs Soybeans previous week (56.7 percent)
Soybean Oil (0.0 percent) vs Soybean Oil previous week (4.7 percent)
Soybean Meal (67.4 percent) vs Soybean Meal previous week (77.2 percent)
Live Cattle (50.6 percent) vs Live Cattle previous week (56.2 percent)
Lean Hogs (0.0 percent) vs Lean Hogs previous week (4.0 percent)
Cotton (1.1 percent) vs Cotton previous week (0.0 percent)
Cocoa (100.0 percent) vs Cocoa previous week (70.1 percent)
Wheat (10.6 percent) vs Wheat previous week (11.7 percent)
Cocoa & Coffee top the 6-Week Strength Trends
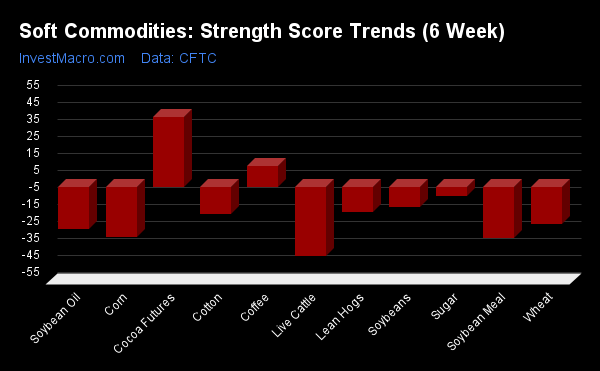
COT Strength Score Trends (or move index, calculates the 6-week changes in strength scores) showed that Cocoa (41 percent) and Coffee (12 percent) lead the past six weeks trends for soft commodities.
Live Cattle (-41 percent) leads the downside trend scores currently with Soybean Meal (-30 percent), Corn (-30 percent) and Soybean Oil (-25 percent) following next with lower trend scores.
Strength Trend Statistics:
Corn (-29.8 percent) vs Corn previous week (-28.5 percent)
Sugar (-5.5 percent) vs Sugar previous week (-8.7 percent)
Coffee (12.0 percent) vs Coffee previous week (17.0 percent)
Soybeans (-12.1 percent) vs Soybeans previous week (-1.2 percent)
Soybean Oil (-24.7 percent) vs Soybean Oil previous week (-17.5 percent)
Soybean Meal (-30.1 percent) vs Soybean Meal previous week (-14.5 percent)
Live Cattle (-40.5 percent) vs Live Cattle previous week (-28.4 percent)
Lean Hogs (-15.0 percent) vs Lean Hogs previous week (-9.2 percent)
Cotton (-16.0 percent) vs Cotton previous week (-17.6 percent)
Cocoa (41.4 percent) vs Cocoa previous week (19.7 percent)
Wheat (-22.0 percent) vs Wheat previous week (-10.7 percent)
Individual Soft Commodities Markets:
CORN Futures:
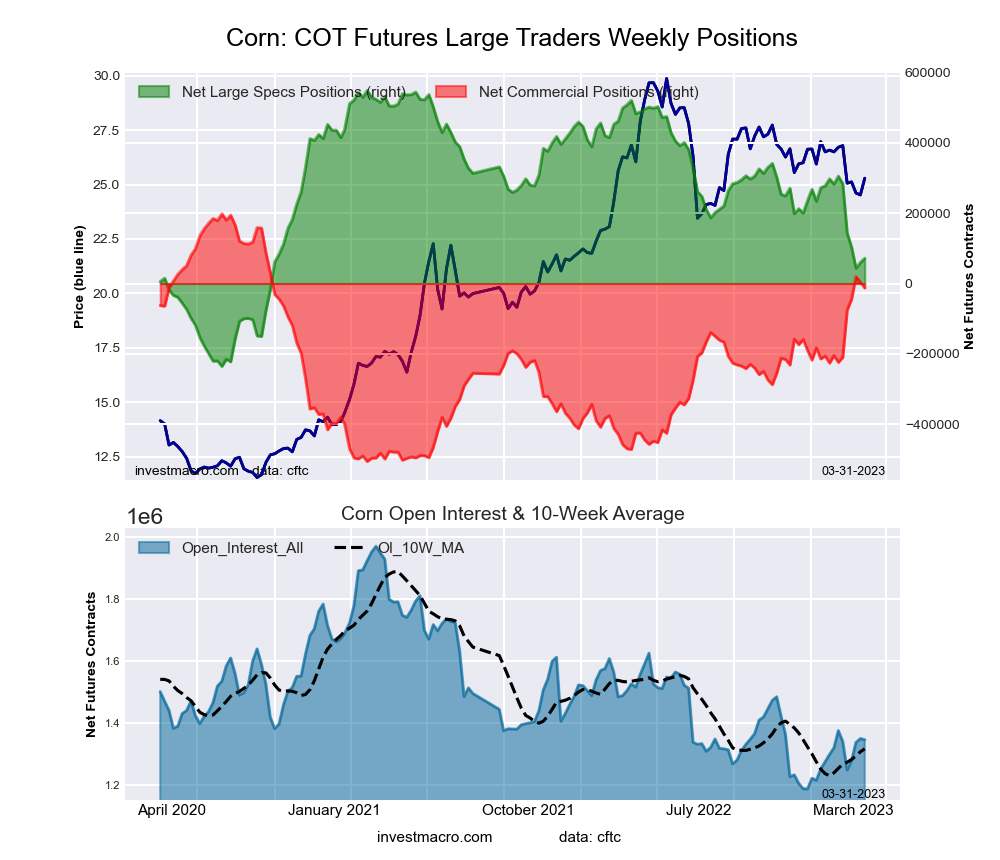
The CORN large speculator standing this week reached a net position of 71,528 contracts in the data reported through Tuesday. This was a weekly boost of 12,052 contracts from the previous week which had a total of 59,476 net contracts.
This week’s current strength score (the trader positioning range over the past three years, measured from 0 to 100) shows the speculators are currently Bearish with a score of 39.2 percent. The commercials are Bullish with a score of 70.1 percent and the small traders (not shown in chart) are Bearish-Extreme with a score of 18.2 percent.
| CORN Futures Statistics | SPECULATORS | COMMERCIALS | SMALL TRADERS |
| – Percent of Open Interest Longs: | 23.6 | 49.1 | 8.4 |
| – Percent of Open Interest Shorts: | 18.3 | 50.1 | 12.7 |
| – Net Position: | 71,528 | -12,518 | -59,010 |
| – Gross Longs: | 317,171 | 661,172 | 112,429 |
| – Gross Shorts: | 245,643 | 673,690 | 171,439 |
| – Long to Short Ratio: | 1.3 to 1 | 1.0 to 1 | 0.7 to 1 |
| NET POSITION TREND: | |||
| – Strength Index Score (3 Year Range Pct): | 39.2 | 70.1 | 18.2 |
| – Strength Index Reading (3 Year Range): | Bearish | Bullish | Bearish-Extreme |
| NET POSITION MOVEMENT INDEX: | |||
| – 6-Week Change in Strength Index: | -29.8 | 30.0 | 18.2 |
SUGAR Futures:
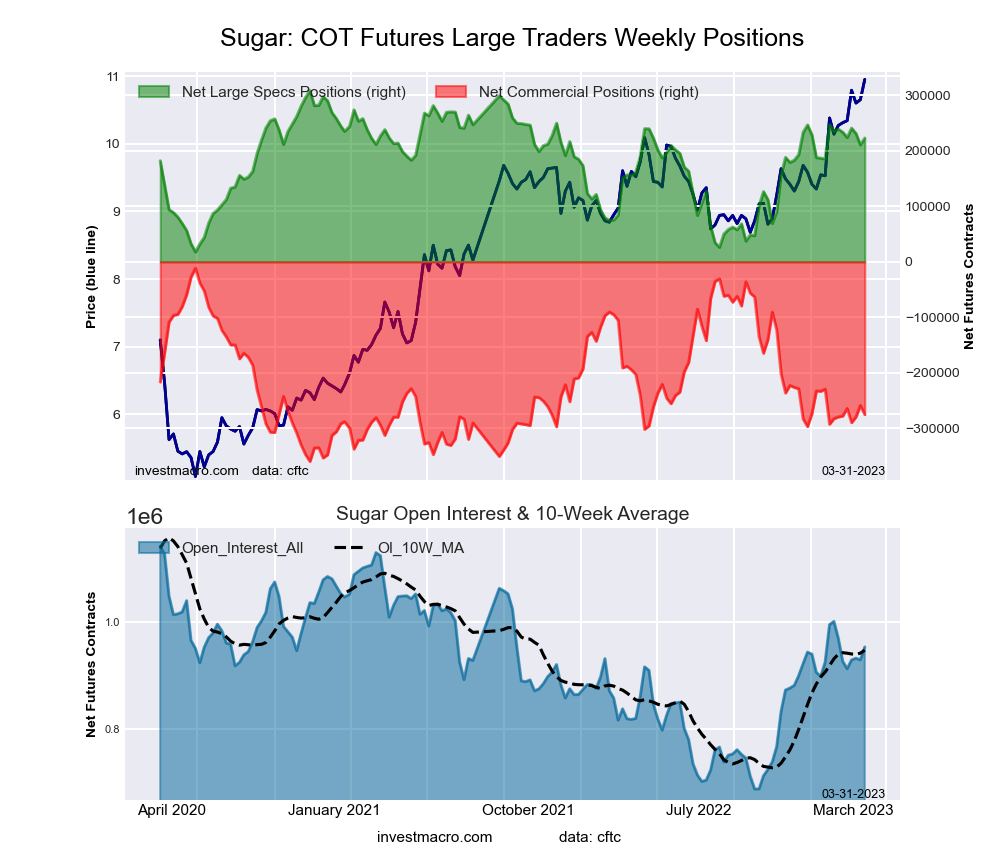
The SUGAR large speculator standing this week reached a net position of 222,829 contracts in the data reported through Tuesday. This was a weekly gain of 12,173 contracts from the previous week which had a total of 210,656 net contracts.
This week’s current strength score (the trader positioning range over the past three years, measured from 0 to 100) shows the speculators are currently Bullish with a score of 70.5 percent. The commercials are Bearish with a score of 24.2 percent and the small traders (not shown in chart) are Bullish with a score of 72.5 percent.
| SUGAR Futures Statistics | SPECULATORS | COMMERCIALS | SMALL TRADERS |
| – Percent of Open Interest Longs: | 33.0 | 37.5 | 11.1 |
| – Percent of Open Interest Shorts: | 9.6 | 66.4 | 5.6 |
| – Net Position: | 222,829 | -275,157 | 52,328 |
| – Gross Longs: | 314,608 | 357,720 | 106,016 |
| – Gross Shorts: | 91,779 | 632,877 | 53,688 |
| – Long to Short Ratio: | 3.4 to 1 | 0.6 to 1 | 2.0 to 1 |
| NET POSITION TREND: | |||
| – Strength Index Score (3 Year Range Pct): | 70.5 | 24.2 | 72.5 |
| – Strength Index Reading (3 Year Range): | Bullish | Bearish | Bullish |
| NET POSITION MOVEMENT INDEX: | |||
| – 6-Week Change in Strength Index: | -5.5 | 1.2 | 14.6 |
COFFEE Futures:
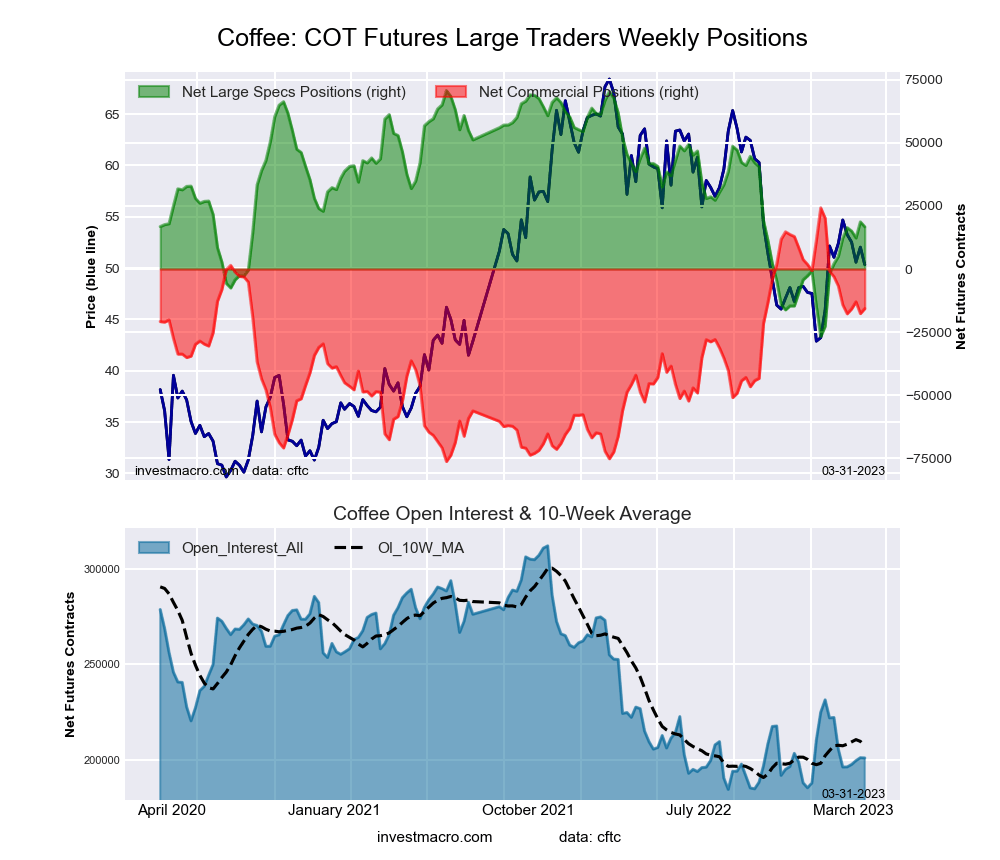
The COFFEE large speculator standing this week reached a net position of 16,751 contracts in the data reported through Tuesday. This was a weekly reduction of -1,945 contracts from the previous week which had a total of 18,696 net contracts.
This week’s current strength score (the trader positioning range over the past three years, measured from 0 to 100) shows the speculators are currently Bearish with a score of 44.6 percent. The commercials are Bullish with a score of 60.3 percent and the small traders (not shown in chart) are Bearish-Extreme with a score of 0.0 percent.
| COFFEE Futures Statistics | SPECULATORS | COMMERCIALS | SMALL TRADERS |
| – Percent of Open Interest Longs: | 20.0 | 49.1 | 4.6 |
| – Percent of Open Interest Shorts: | 11.6 | 57.0 | 5.1 |
| – Net Position: | 16,751 | -15,709 | -1,042 |
| – Gross Longs: | 40,112 | 98,733 | 9,239 |
| – Gross Shorts: | 23,361 | 114,442 | 10,281 |
| – Long to Short Ratio: | 1.7 to 1 | 0.9 to 1 | 0.9 to 1 |
| NET POSITION TREND: | |||
| – Strength Index Score (3 Year Range Pct): | 44.6 | 60.3 | 0.0 |
| – Strength Index Reading (3 Year Range): | Bearish | Bullish | Bearish-Extreme |
| NET POSITION MOVEMENT INDEX: | |||
| – 6-Week Change in Strength Index: | 12.0 | -8.9 | -33.3 |
SOYBEANS Futures:
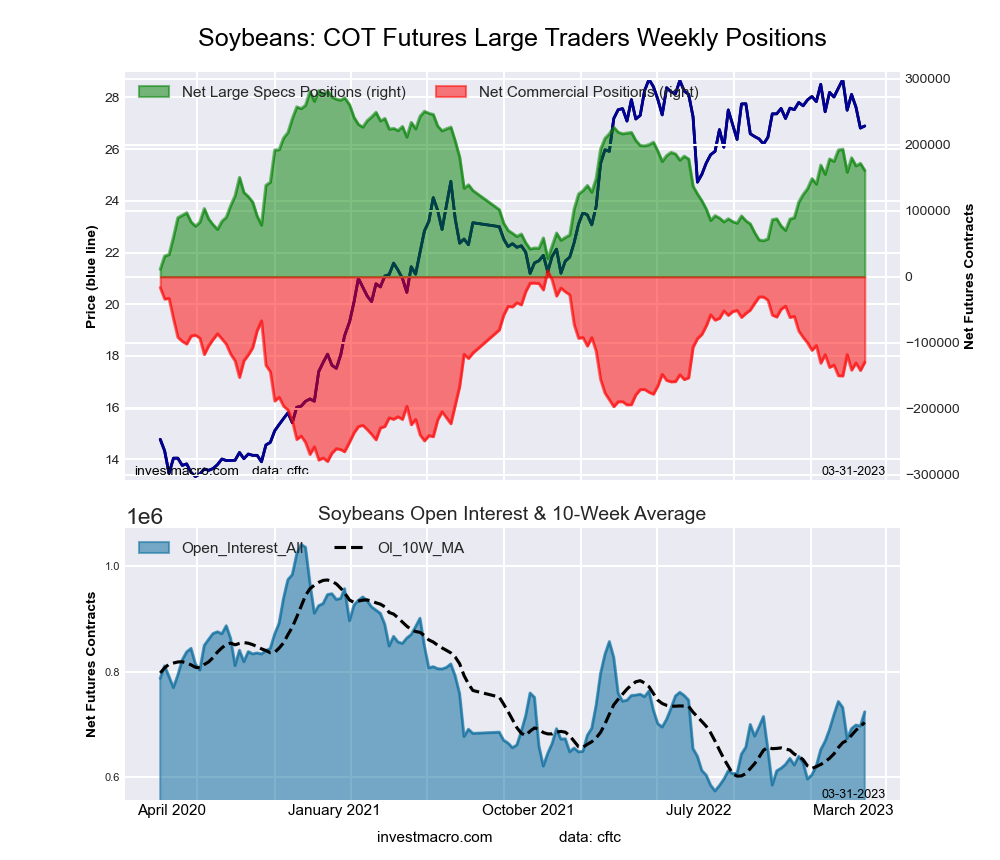
The SOYBEANS large speculator standing this week reached a net position of 161,020 contracts in the data reported through Tuesday. This was a weekly decrease of -10,767 contracts from the previous week which had a total of 171,787 net contracts.
This week’s current strength score (the trader positioning range over the past three years, measured from 0 to 100) shows the speculators are currently Bullish with a score of 52.4 percent. The commercials are Bullish with a score of 52.1 percent and the small traders (not shown in chart) are Bearish-Extreme with a score of 19.0 percent.
| SOYBEANS Futures Statistics | SPECULATORS | COMMERCIALS | SMALL TRADERS |
| – Percent of Open Interest Longs: | 28.3 | 45.2 | 6.5 |
| – Percent of Open Interest Shorts: | 6.0 | 63.0 | 10.8 |
| – Net Position: | 161,020 | -129,321 | -31,699 |
| – Gross Longs: | 204,717 | 326,718 | 46,723 |
| – Gross Shorts: | 43,697 | 456,039 | 78,422 |
| – Long to Short Ratio: | 4.7 to 1 | 0.7 to 1 | 0.6 to 1 |
| NET POSITION TREND: | |||
| – Strength Index Score (3 Year Range Pct): | 52.4 | 52.1 | 19.0 |
| – Strength Index Reading (3 Year Range): | Bullish | Bullish | Bearish-Extreme |
| NET POSITION MOVEMENT INDEX: | |||
| – 6-Week Change in Strength Index: | -12.1 | 7.1 | 17.3 |
SOYBEAN OIL Futures:
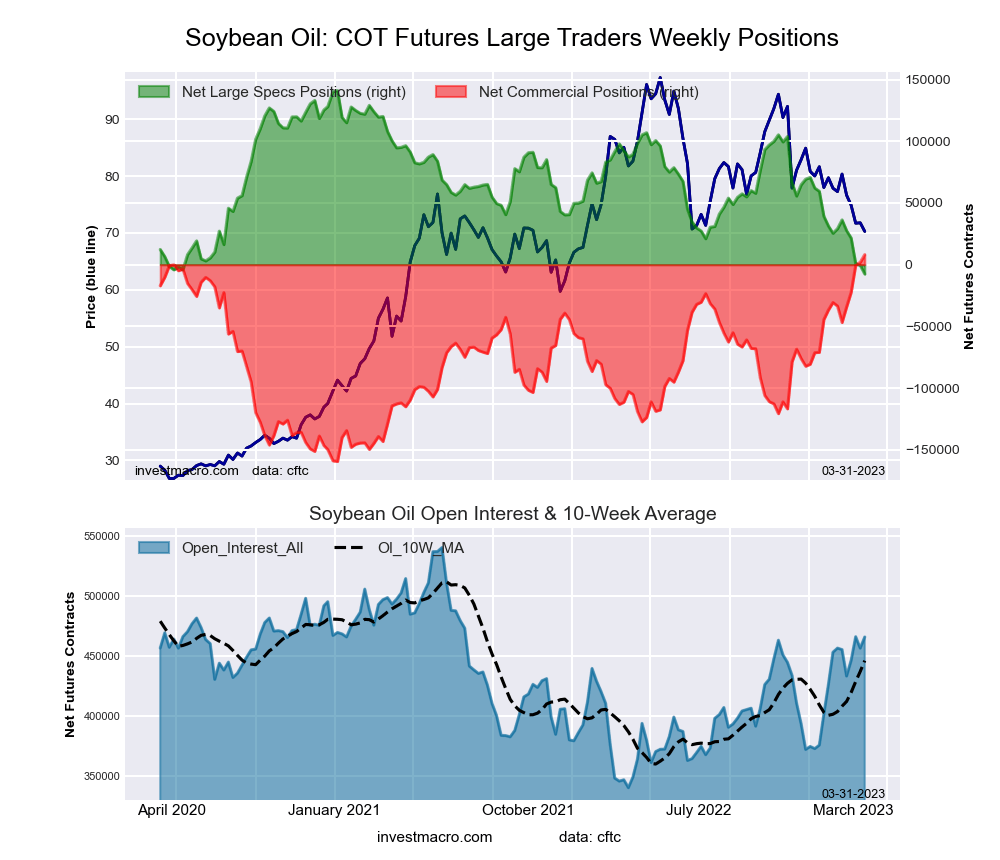
The SOYBEAN OIL large speculator standing this week reached a net position of -7,608 contracts in the data reported through Tuesday. This was a weekly decline of -7,041 contracts from the previous week which had a total of -567 net contracts.
This week’s current strength score (the trader positioning range over the past three years, measured from 0 to 100) shows the speculators are currently Bearish-Extreme with a score of 0.0 percent. The commercials are Bullish-Extreme with a score of 100.0 percent and the small traders (not shown in chart) are Bearish-Extreme with a score of 3.3 percent.
| SOYBEAN OIL Futures Statistics | SPECULATORS | COMMERCIALS | SMALL TRADERS |
| – Percent of Open Interest Longs: | 14.6 | 58.2 | 6.3 |
| – Percent of Open Interest Shorts: | 16.3 | 56.4 | 6.4 |
| – Net Position: | -7,608 | 8,146 | -538 |
| – Gross Longs: | 68,222 | 270,893 | 29,443 |
| – Gross Shorts: | 75,830 | 262,747 | 29,981 |
| – Long to Short Ratio: | 0.9 to 1 | 1.0 to 1 | 1.0 to 1 |
| NET POSITION TREND: | |||
| – Strength Index Score (3 Year Range Pct): | 0.0 | 100.0 | 3.3 |
| – Strength Index Reading (3 Year Range): | Bearish-Extreme | Bullish-Extreme | Bearish-Extreme |
| NET POSITION MOVEMENT INDEX: | |||
| – 6-Week Change in Strength Index: | -24.7 | 24.9 | -20.1 |
SOYBEAN MEAL Futures:
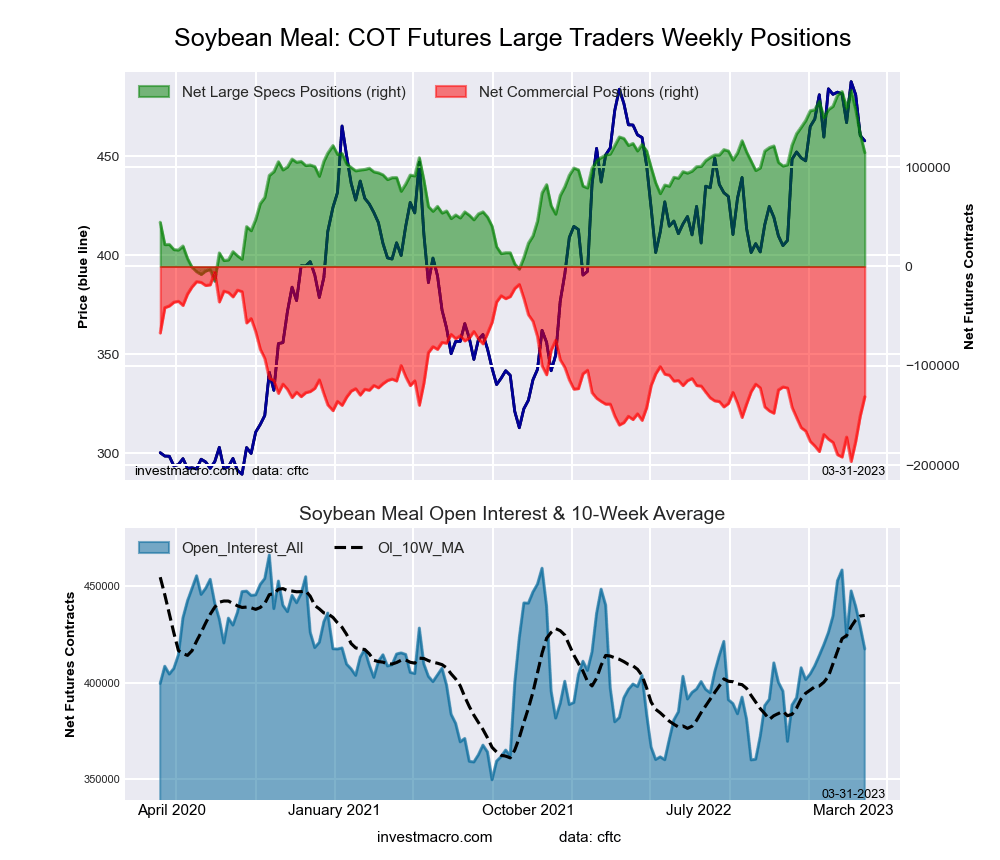
The SOYBEAN MEAL large speculator standing this week reached a net position of 114,541 contracts in the data reported through Tuesday. This was a weekly decline of -18,802 contracts from the previous week which had a total of 133,343 net contracts.
This week’s current strength score (the trader positioning range over the past three years, measured from 0 to 100) shows the speculators are currently Bullish with a score of 67.4 percent. The commercials are Bearish with a score of 34.2 percent and the small traders (not shown in chart) are Bearish with a score of 21.4 percent.
| SOYBEAN MEAL Futures Statistics | SPECULATORS | COMMERCIALS | SMALL TRADERS |
| – Percent of Open Interest Longs: | 33.1 | 38.3 | 10.4 |
| – Percent of Open Interest Shorts: | 5.6 | 69.7 | 6.5 |
| – Net Position: | 114,541 | -131,095 | 16,554 |
| – Gross Longs: | 138,126 | 159,905 | 43,573 |
| – Gross Shorts: | 23,585 | 291,000 | 27,019 |
| – Long to Short Ratio: | 5.9 to 1 | 0.5 to 1 | 1.6 to 1 |
| NET POSITION TREND: | |||
| – Strength Index Score (3 Year Range Pct): | 67.4 | 34.2 | 21.4 |
| – Strength Index Reading (3 Year Range): | Bullish | Bearish | Bearish |
| NET POSITION MOVEMENT INDEX: | |||
| – 6-Week Change in Strength Index: | -30.1 | 30.6 | -2.1 |
LIVE CATTLE Futures:
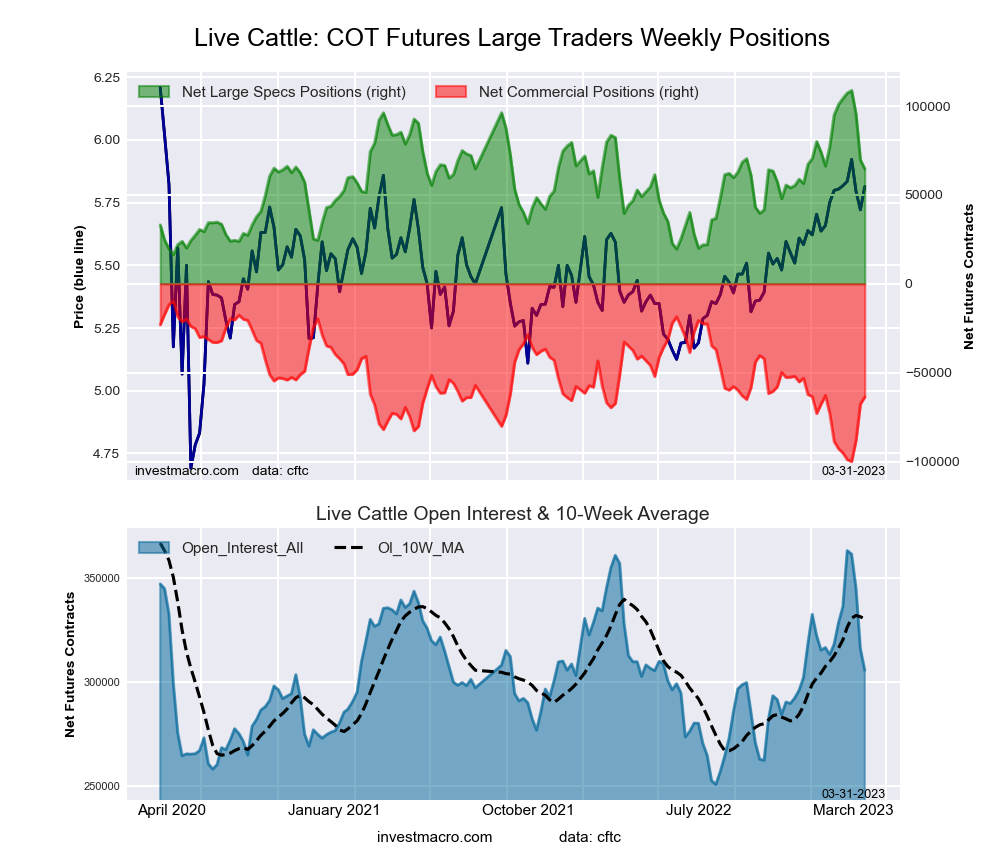
The LIVE CATTLE large speculator standing this week reached a net position of 64,698 contracts in the data reported through Tuesday. This was a weekly decline of -5,002 contracts from the previous week which had a total of 69,700 net contracts.
This week’s current strength score (the trader positioning range over the past three years, measured from 0 to 100) shows the speculators are currently Bullish with a score of 50.6 percent. The commercials are Bearish with a score of 44.1 percent and the small traders (not shown in chart) are Bullish-Extreme with a score of 83.6 percent.
| LIVE CATTLE Futures Statistics | SPECULATORS | COMMERCIALS | SMALL TRADERS |
| – Percent of Open Interest Longs: | 36.7 | 28.9 | 12.4 |
| – Percent of Open Interest Shorts: | 15.5 | 49.7 | 12.8 |
| – Net Position: | 64,698 | -63,683 | -1,015 |
| – Gross Longs: | 112,147 | 88,378 | 38,033 |
| – Gross Shorts: | 47,449 | 152,061 | 39,048 |
| – Long to Short Ratio: | 2.4 to 1 | 0.6 to 1 | 1.0 to 1 |
| NET POSITION TREND: | |||
| – Strength Index Score (3 Year Range Pct): | 50.6 | 44.1 | 83.6 |
| – Strength Index Reading (3 Year Range): | Bullish | Bearish | Bullish-Extreme |
| NET POSITION MOVEMENT INDEX: | |||
| – 6-Week Change in Strength Index: | -40.5 | 35.3 | 39.0 |
LEAN HOGS Futures:
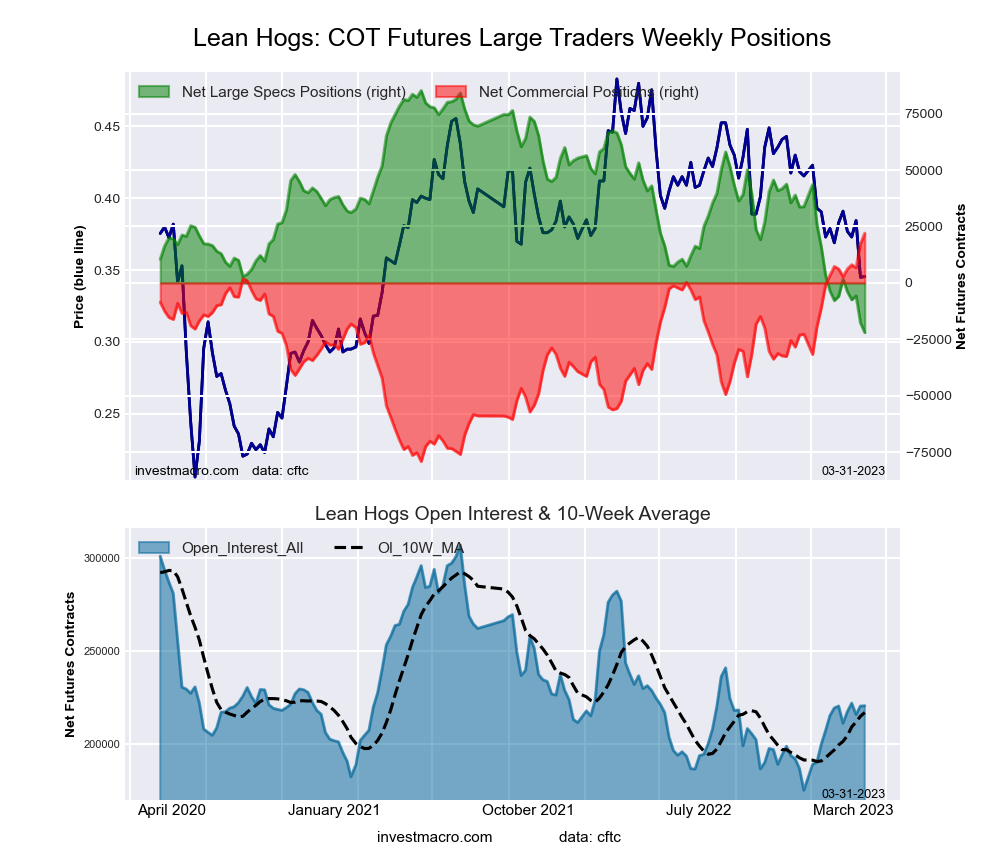
The LEAN HOGS large speculator standing this week reached a net position of -22,003 contracts in the data reported through Tuesday. This was a weekly decrease of -4,350 contracts from the previous week which had a total of -17,653 net contracts.
This week’s current strength score (the trader positioning range over the past three years, measured from 0 to 100) shows the speculators are currently Bearish-Extreme with a score of 0.0 percent. The commercials are Bullish-Extreme with a score of 100.0 percent and the small traders (not shown in chart) are Bullish-Extreme with a score of 97.5 percent.
| LEAN HOGS Futures Statistics | SPECULATORS | COMMERCIALS | SMALL TRADERS |
| – Percent of Open Interest Longs: | 29.5 | 37.4 | 11.1 |
| – Percent of Open Interest Shorts: | 39.5 | 27.4 | 11.1 |
| – Net Position: | -22,003 | 21,983 | 20 |
| – Gross Longs: | 64,990 | 82,478 | 24,503 |
| – Gross Shorts: | 86,993 | 60,495 | 24,483 |
| – Long to Short Ratio: | 0.7 to 1 | 1.4 to 1 | 1.0 to 1 |
| NET POSITION TREND: | |||
| – Strength Index Score (3 Year Range Pct): | 0.0 | 100.0 | 97.5 |
| – Strength Index Reading (3 Year Range): | Bearish-Extreme | Bullish-Extreme | Bullish-Extreme |
| NET POSITION MOVEMENT INDEX: | |||
| – 6-Week Change in Strength Index: | -15.0 | 15.7 | 1.5 |
COTTON Futures:
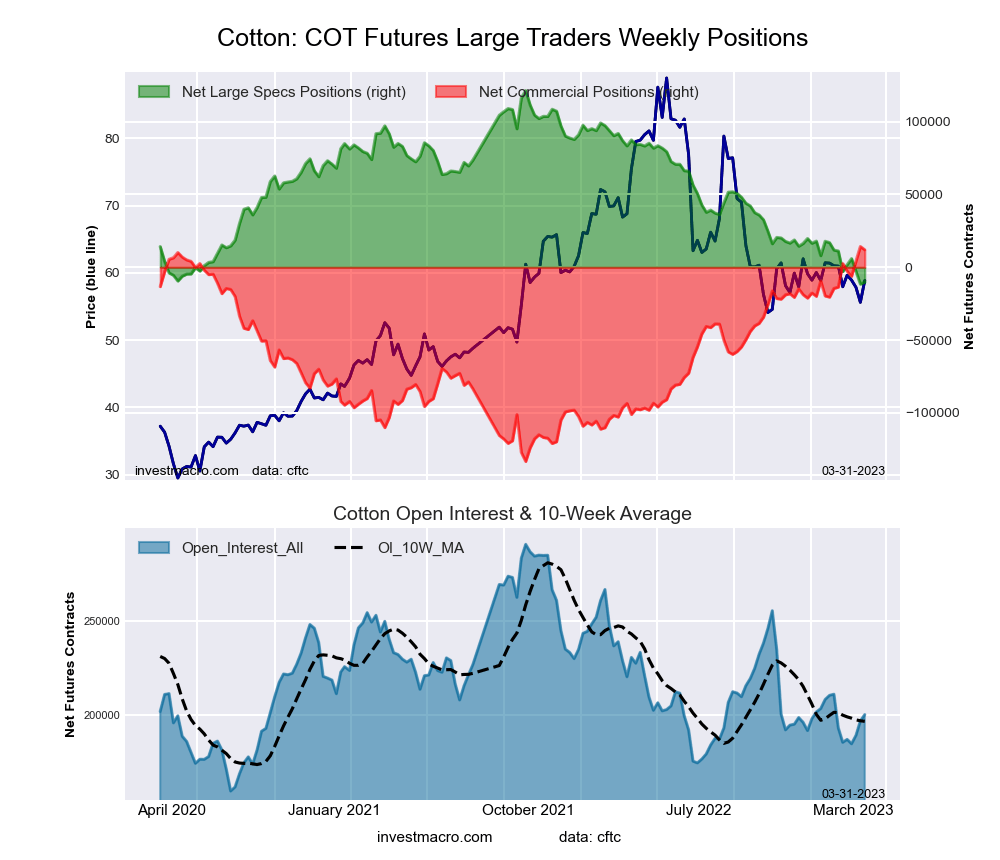
The COTTON large speculator standing this week reached a net position of -10,121 contracts in the data reported through Tuesday. This was a weekly rise of 1,461 contracts from the previous week which had a total of -11,582 net contracts.
This week’s current strength score (the trader positioning range over the past three years, measured from 0 to 100) shows the speculators are currently Bearish-Extreme with a score of 1.1 percent. The commercials are Bullish-Extreme with a score of 98.5 percent and the small traders (not shown in chart) are Bearish-Extreme with a score of 4.7 percent.
| COTTON Futures Statistics | SPECULATORS | COMMERCIALS | SMALL TRADERS |
| – Percent of Open Interest Longs: | 25.4 | 50.0 | 5.5 |
| – Percent of Open Interest Shorts: | 30.5 | 44.0 | 6.5 |
| – Net Position: | -10,121 | 11,990 | -1,869 |
| – Gross Longs: | 50,893 | 99,934 | 11,070 |
| – Gross Shorts: | 61,014 | 87,944 | 12,939 |
| – Long to Short Ratio: | 0.8 to 1 | 1.1 to 1 | 0.9 to 1 |
| NET POSITION TREND: | |||
| – Strength Index Score (3 Year Range Pct): | 1.1 | 98.5 | 4.7 |
| – Strength Index Reading (3 Year Range): | Bearish-Extreme | Bullish-Extreme | Bearish-Extreme |
| NET POSITION MOVEMENT INDEX: | |||
| – 6-Week Change in Strength Index: | -16.0 | 17.4 | -26.2 |
COCOA Futures:
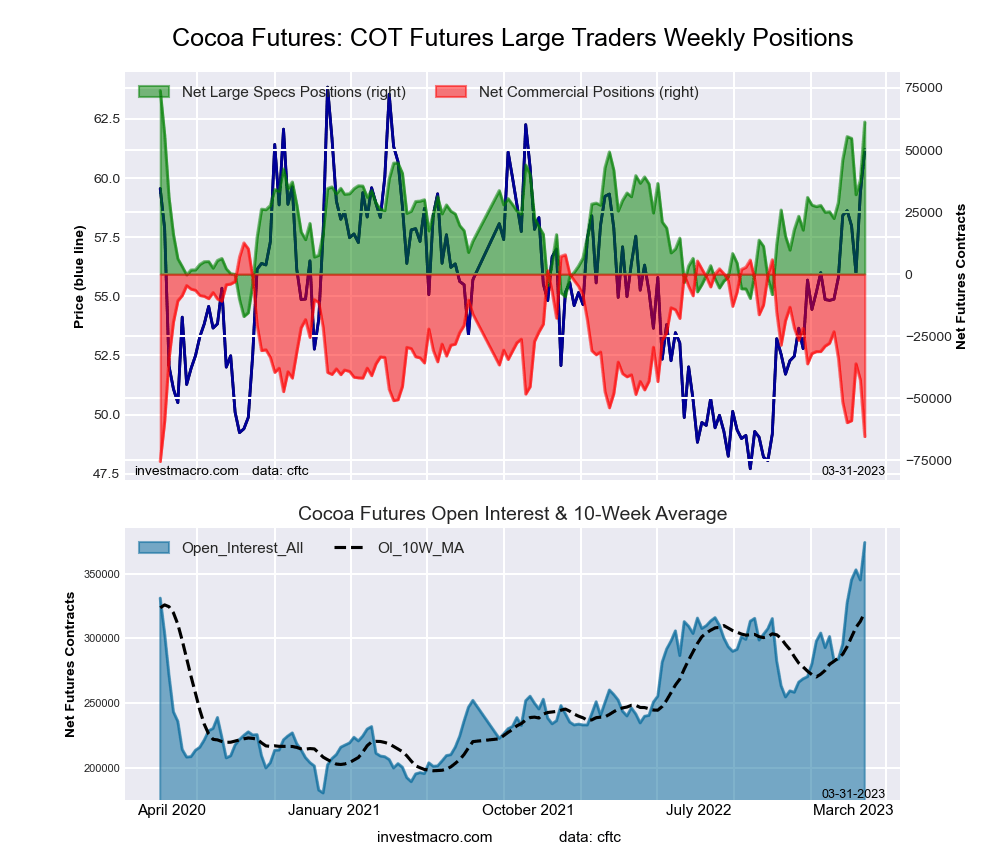
The COCOA large speculator standing this week reached a net position of 61,273 contracts in the data reported through Tuesday. This was a weekly boost of 23,427 contracts from the previous week which had a total of 37,846 net contracts.
This week’s current strength score (the trader positioning range over the past three years, measured from 0 to 100) shows the speculators are currently Bullish-Extreme with a score of 100.0 percent. The commercials are Bearish-Extreme with a score of 0.0 percent and the small traders (not shown in chart) are Bearish with a score of 38.0 percent.
| COCOA Futures Statistics | SPECULATORS | COMMERCIALS | SMALL TRADERS |
| – Percent of Open Interest Longs: | 32.4 | 36.2 | 4.5 |
| – Percent of Open Interest Shorts: | 16.0 | 53.7 | 3.4 |
| – Net Position: | 61,273 | -65,418 | 4,145 |
| – Gross Longs: | 121,238 | 135,582 | 16,709 |
| – Gross Shorts: | 59,965 | 201,000 | 12,564 |
| – Long to Short Ratio: | 2.0 to 1 | 0.7 to 1 | 1.3 to 1 |
| NET POSITION TREND: | |||
| – Strength Index Score (3 Year Range Pct): | 100.0 | 0.0 | 38.0 |
| – Strength Index Reading (3 Year Range): | Bullish-Extreme | Bearish-Extreme | Bearish |
| NET POSITION MOVEMENT INDEX: | |||
| – 6-Week Change in Strength Index: | 41.4 | -40.7 | -6.8 |
WHEAT Futures:
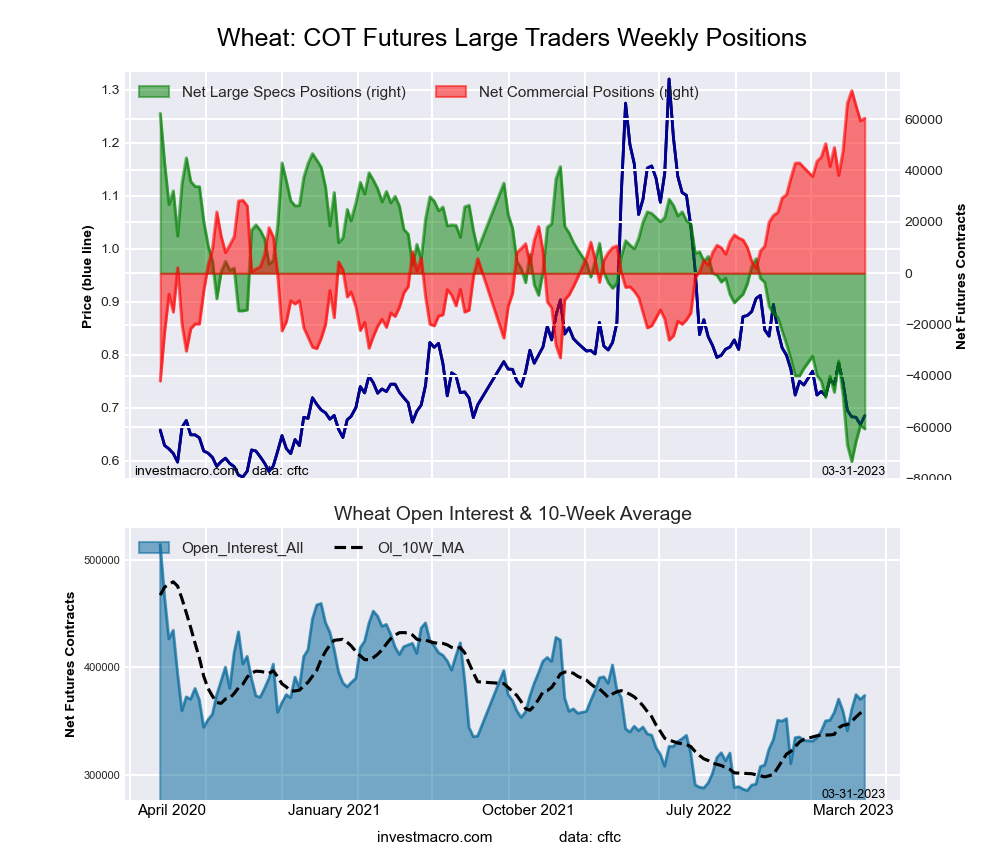
The WHEAT large speculator standing this week reached a net position of -60,545 contracts in the data reported through Tuesday. This was a weekly decrease of -1,342 contracts from the previous week which had a total of -59,203 net contracts.
This week’s current strength score (the trader positioning range over the past three years, measured from 0 to 100) shows the speculators are currently Bearish-Extreme with a score of 10.6 percent. The commercials are Bullish-Extreme with a score of 90.0 percent and the small traders (not shown in chart) are Bullish-Extreme with a score of 91.6 percent.
| WHEAT Futures Statistics | SPECULATORS | COMMERCIALS | SMALL TRADERS |
| – Percent of Open Interest Longs: | 27.2 | 35.5 | 9.7 |
| – Percent of Open Interest Shorts: | 43.4 | 19.3 | 9.6 |
| – Net Position: | -60,545 | 60,324 | 221 |
| – Gross Longs: | 101,707 | 132,616 | 36,122 |
| – Gross Shorts: | 162,252 | 72,292 | 35,901 |
| – Long to Short Ratio: | 0.6 to 1 | 1.8 to 1 | 1.0 to 1 |
| NET POSITION TREND: | |||
| – Strength Index Score (3 Year Range Pct): | 10.6 | 90.0 | 91.6 |
| – Strength Index Reading (3 Year Range): | Bearish-Extreme | Bullish-Extreme | Bullish-Extreme |
| NET POSITION MOVEMENT INDEX: | |||
| – 6-Week Change in Strength Index: | -22.0 | 20.7 | 17.8 |
*COT Report: The COT data, released weekly to the public each Friday, is updated through the most recent Tuesday (data is 3 days old) and shows a quick view of how large speculators or non-commercials (for-profit traders) were positioned in the futures markets.
The CFTC categorizes trader positions according to commercial hedgers (traders who use futures contracts for hedging as part of the business), non-commercials (large traders who speculate to realize trading profits) and nonreportable traders (usually small traders/speculators) as well as their open interest (contracts open in the market at time of reporting). See CFTC criteria here.
More By This Author:
Large Speculators Have Dropped Their Corn Bullish Bets To Near 130-Week Lows
Currency Speculators Drop Their Canadian Dollar Bets Fall To 218-Week Low
COT Bonds Speculators Boosting 2-Year Bond Bets After Record Low
Disclosure: Foreign Currency trading and trading on margin carries a high level of risk and can result in loss of part or all of your investment.Due to the level of risk and market volatility, ...
more
Comments
 No Thumbs up yet!

