
Seven-Chart Sunday: March 6, 2022
In this text, I provide seven (or more) charts from the past week that tell an interesting story in markets and investing. Let's dive right into the details.
1) King Dollar
The collapse in Russian securities continued this week, with widespread implications across financial markets. The Russian ruble hit new all-time lows again and has now lost 40% of its value against the US dollar in just a few short weeks.

As is often the case during crises, the dollar has become a safe haven. The Dollar Index is now at a 52-week high and at levels we haven’t seen since the 2020 pandemic crash.

The recent strength in the dollar is a continuation of a trend we’ve been witnessing for over a decade. Here’s a look at the worst performing global currencies versus the US dollar in the past 10 years. As you can see, it’s quite a long list.

Note: G20 Currencies Highlighted
2) Black Swans
The swift attempt to cut off Russia from the world is a black swan event that no one had predicted. The Russian stock market has now been closed since Feb. 28 and will remain closed for at least two more trading days in the upcoming week (March 7/8).
As a result of these closures and the anticipated ramifications from global sanctions, Russian securities traded in the US and abroad have plummeted. OTC trading in the US was halted for the six largest Russian companies, but not before those stocks incurred two-week losses of 74%-96%. This list includes Russia’s largest energy company (Gazprom) and largest bank (Sberbank).

Additionally, trading in the MSCI Russia ETF (ERUS) was finally suspended on March 4 after falling 33% in a single trading day earlier in the week. This was a 16-sigma event and a reminder once again that financial markets do not follow a normal distribution (tail events happen with much greater frequency).
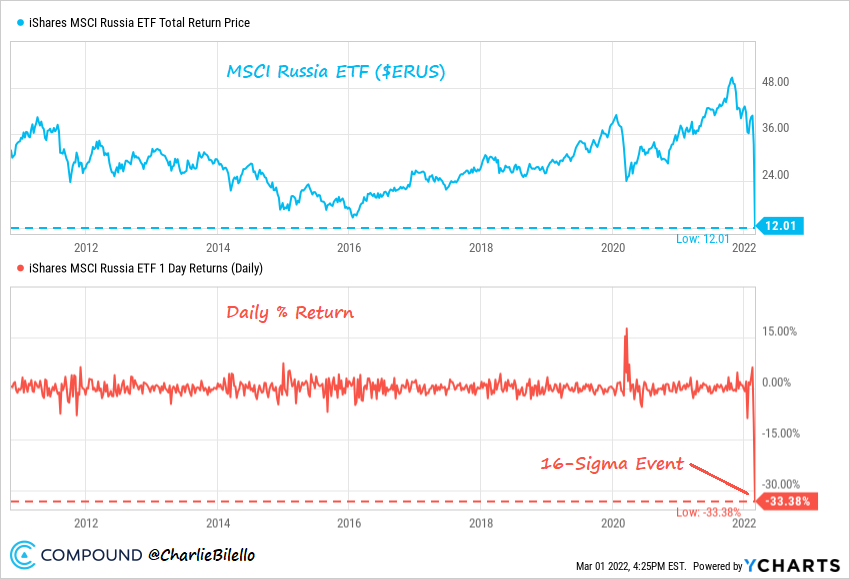
The drawdown for the MSCI Russia ETF (ERUS) stood at 84% before it stopped trading, and the VanEck Russia ETF (RSX), which is still trading for now, is down 85% from its peak.

In an unprecedented move, 3 major index providers (MSCI, FTSE, and S&P Dow Jones) have decided to remove Russian stocks from their indices “at a price that is effectively zero” and strip the country of its “emerging market” status.
3) The Two Sides of Leverage
Speaking of “effectively zero,” that’s what investors in the 2x Russia ETF will be receiving when the fund liquidates on March 18.

A $10,000 investment in that ETF when the fund debuted in May 2011 is now worth just $18. The same investment in the 2x Nasdaq 100 ETF would be worth $231,000 today.

4) Supply Shocks
Given the inflationary spiral and continued supply chain disruptions, the last thing we needed was a further hit to supply. But that’s precisely what we’re seeing in many of the most important commodities, as continued trade with Russia becomes more uncertain with each passing day.
The result has been a spike higher in just about everything.
- Crude oil has never been this high ($116) during the month of March, increasing over 50% since the start of the year.

- Gas Prices in the US have surged back above $4.00 per gallon (from $2.76 a year ago) and are within spitting distance of their all-time highs from July 2008 ($4.11).

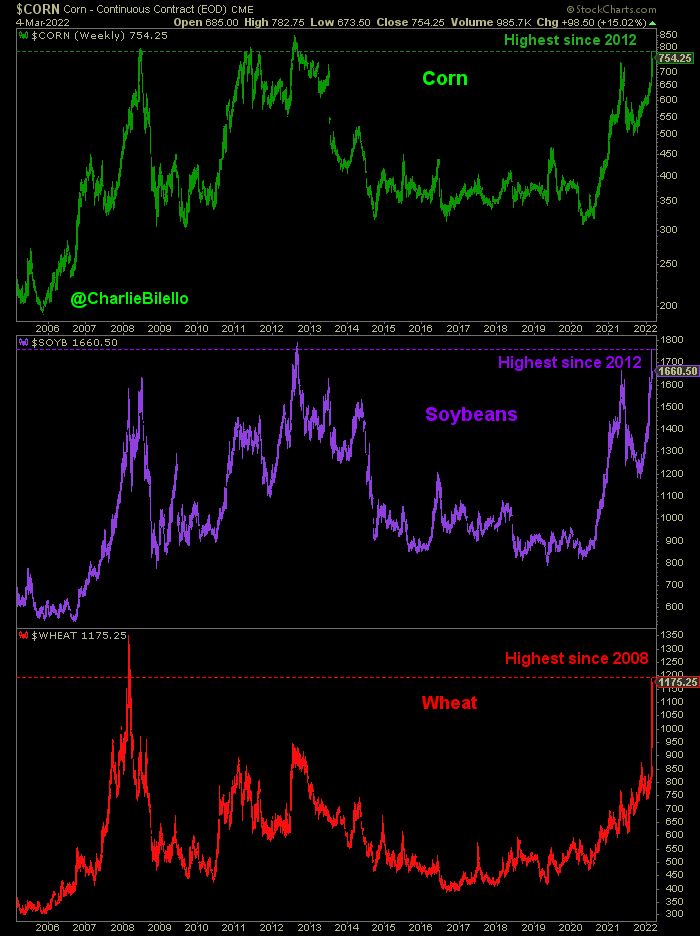
- The price of corn and soybeans has spiked to the highest level since 2012, while wheat is at its highest level since 2008. Who is the largest exporter of wheat? Russia.
5) Eurozone Bear Market
The impact of higher commodity prices, particularly oil and gas, is expected to hit the Eurozone hard in the coming weeks/months. Many countries there have developed a high dependence on Russia to meet their energy needs. One example: Germany, the largest economy in Europe, imports 65% of its natural gas from Russia.
The MSCI Eurozone ETF (EZU) is now down 22% from its high, and is trading at the same levels it was trading at back in 2007.

European bank stocks are down even more, pushing the ratio of European Financials (EUFN) to US Financials (XLF) down to new all-time lows.

6) Reversal of Fortunes
The crash in high growth names continues, with the 2021-22 losses erasing the 2020 gains of many former leaders.

The ARK Innovation ETF (ARKK), which has held a number of these names, is now down 63% from its high in February 2021. All of its relative outperformance is gone, and it now trails the Nasdaq 100 by 30% since its inception.

A reversal of fortunes for the ages: the early pandemic leader Zoom (ZM) is down 13% over the last two years while the early pandemic laggard Exxon Mobil (XOM) is up 92%.

7) The Greatest Jobs Comeback in History
Let’s end with something positive. The greatest jobs comeback in US history continued in February with a very strong jobs report. Private sector payrolls (ADP – 1st chart) are nearly back to pre-pandemic levels (600 thousand away) while total nonfarm payrolls (2nd chart) are approaching their prior highs as well (2.1 million away).


The good news: there are still over 10.9 million job openings in the US, which is 4.7 million higher than the number of unemployed persons, a record spread.

And at 3.8%, the US Unemployment Rate has moved down to its lowest level since the start of the pandemic.

Disclosure: Charts are provided and sponsored by YCharts. Mention Charlie Bilello to receive 20% off your subscription when you initially more


