
I see excesses in many places; in housing prices, stock prices, traditional equity valuation metrics, margin debt, new stock issuance (IPOs), speculation activity, and so on. All based on confidence or faith that low-interest rates and fiscal and monetary stimulus will continue forever. My friends, who earlier had no interest in stocks, are now all in. And I am hearing quite often the alarming sentence, "this time it´s different". If history is any guide, then to me this smells like a bubble.
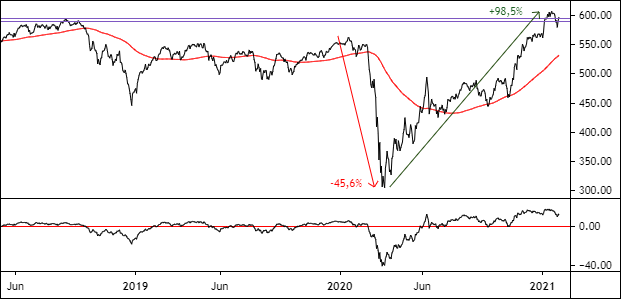
The chart below shows the Value Line Geometric Index, which I believe is the best gauge for the U.S. stock market. From the middle of January to the middle of March last year, the index fell 45,6%. Since then, it is up almost 100%. Keep in mind this is an equal-weighted stock index. The last time it rose that far away from its moving average line was at the start of the bull market in 2009. I think some type of a consolidation or correction is on the horizon, whether it takes place through price or time.
(Click on image to enlarge)
Comments
Log in or sign up to join the conversation.