
Nikkei 225 Elliott Wave Technical Analysis
NIKKEI 225 (N225) – Elliott Wave Analysis – TradingLounge Daily Chart
Japan’s Benchmark Index
NIKKEI 225 – Elliott Wave Technical Analysis
- Function: Counter-Trend
- Mode: Impulsive (Wave C)
- Structure: Navy Blue Wave C
- Position: Gray Wave 2
- Next Higher Degree Direction: Navy Blue Wave 1
- Invalidation Level: 24,601
Analysis Overview:
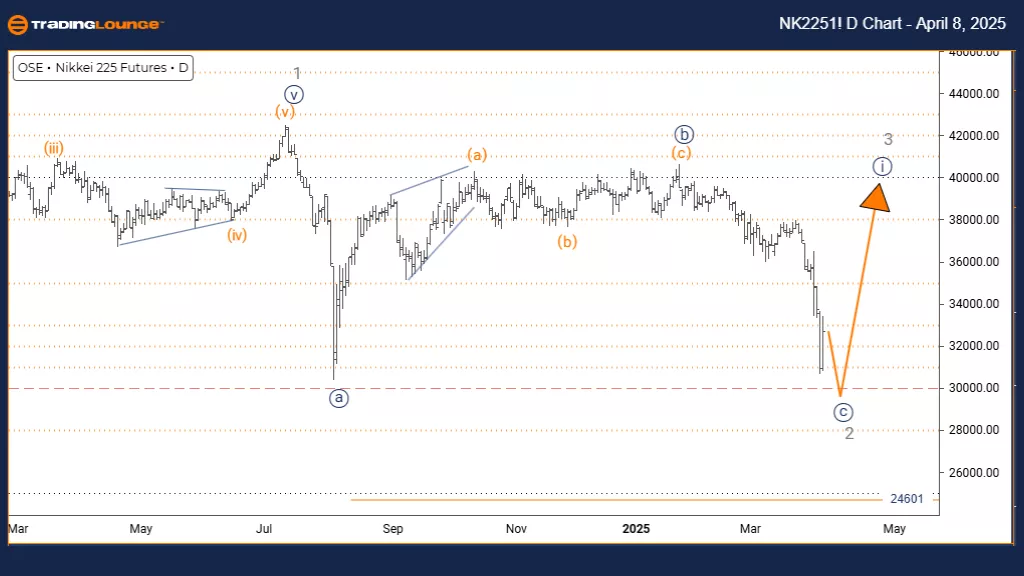
The daily chart analysis of the NIKKEI 225 reflects a counter-trend setup within a broader corrective pattern. The current focus is on Navy Blue Wave C, forming a segment of the larger Gray Wave 2 in the extended wave structure.
Market observations confirm that Navy Blue Wave B has concluded, and the index has entered Wave C of Gray Wave 2, which appears to follow an impulsive path. This implies that the NIKKEI 225 could be approaching the end of its corrective phase, signaling a potential return to the dominant trend direction.
An important invalidation threshold is identified at 24,601. A move below this level would invalidate the present wave interpretation and necessitate a reevaluation of the wave count.
Wave Structure Insights & Strategic Notes:
The daily chart offers a comprehensive view of where the index stands within the higher-degree wave framework. The ongoing Navy Blue Wave C is part of a broader Gray Wave 2 correction and is showing traits of impulsive movement, which is often typical for wave C within corrective setups.
Understanding the wave degree alignment is critical in this scenario. Traders should watch for common five-wave structures, which usually conclude the correction and hint at a forthcoming trend reversal.
Trading Considerations:
- Short-Term Opportunity: Observe Wave C’s progression for end-of-correction signals.
- Long-Term View: Prepare for potential trend continuation once the correction completes.
- Risk Management: Key invalidation level stands at 24,601.
NIKKEI 225 (N225) – Elliott Wave Analysis – TradingLounge Weekly Chart
Japan’s Market Index Outlook
NIKKEI 225 – Elliott Wave Technical Analysis
- Function: Counter-Trend
- Mode: Impulsive (Wave C)
- Structure: Navy Blue Wave C
- Position: Gray Wave 2
- Next Higher Degree Direction: Gray Wave 3
- Invalidation Level: 24,601
Analysis Overview:
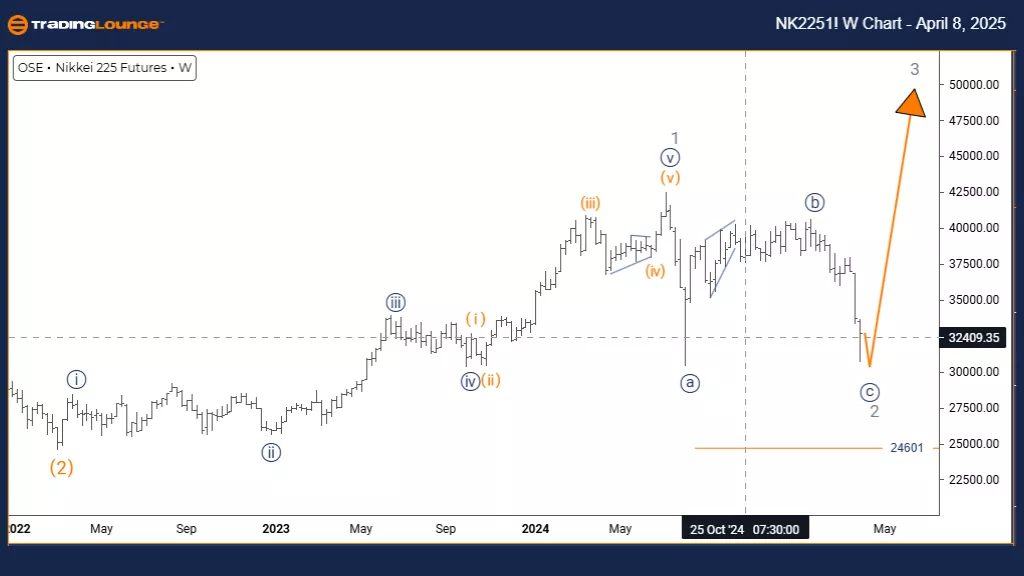
The weekly Elliott Wave analysis for the NIKKEI 225 presents a detailed counter-trend perspective of Japan’s primary stock index, highlighting a complex corrective structure that could have meaningful medium-term implications. The current wave in focus is Navy Blue Wave C, part of the broader Gray Wave 2.
Technical confirmation suggests that Navy Blue Wave B has concluded. The index now moves through Navy Blue Wave C, signaling a continuation of the correction within the Gray Wave 2 sequence. This stage represents a critical point in determining the index’s forthcoming direction.
If the price drops below 24,601, the wave count would be invalidated, making this a key level to watch.
Market Structure and Strategic Outlook:
The weekly chart offers a broad view of the market’s position within a higher-degree wave cycle. The current wave (Navy Blue C) is expected to behave impulsively, which aligns with typical wave C characteristics in corrective setups.
This technical view reinforces the importance of wave relationships. Traders should closely monitor the development of five-wave structures within Wave C, as they often conclude correction patterns and provide strong signals for upcoming trend moves.
Trading Considerations:
- Medium-Term View: Watch for the end of Wave C to prepare for possible Wave 3 advancement.
- Short-Term Action: Evaluate entry and exit points as Wave C evolves.
- Risk Management: The 24,601 level remains a crucial point for invalidating the current structure.
Analyst: Malik Awais
More By This Author:
Elliott Wave Technical Forecast: Insurance Australia Group Limited - Monday, April 7
Elliott Wave Technical Analysis: Amazon
Elliott Wave Technical Analysis: U.S. Dollar/Japanese Yen - Monday, April 7
At TradingLounge™, we provide actionable Elliott Wave analysis across over 200 markets. Access live chat rooms, advanced AI & algorithmic charting tools, and curated trade ...
more

