
My Market Recap is a series of brief, information-rich posts that I will publish periodically, but not on a fixed schedule. I rely on charts to do the heavy lifting and I keep my commentary to a minimum.
If you're like me, you prefer to visualize facts and figures rather than reading about them in a long article. That's why I use charts and tables instead of dull, tedious prose.
I also like to keep things as simple and on-point as possible. When I read an article that wanders off in several different directions before arriving at the ultimate payoff (assuming that there is one), I usually chalk it up to the author's need to meet a word-count quota. I will make these posts as long as they need to be, and no longer.
Chart 1. Major Markets
I divide the global equity market into 7 segments - U.S. Total Market, U.S. Small Cap, U.S. NASDAQ, Foreign Developed, Europe Developed, Asia Large Cap, and Emerging Markets. As with all the charts, I show the year-to-date return. You can follow the money as it moves among these seven segments.
Non-U.S. markets, including EM, DM, and Asia, are outperforming the U.S. markets after underperforming last year. If you want to follow the money, this is a good place to start. It looks like a durable trend. A well-diversified portfolio will have a significant exposure to non-US markets.

Chart 2. Market Sectors
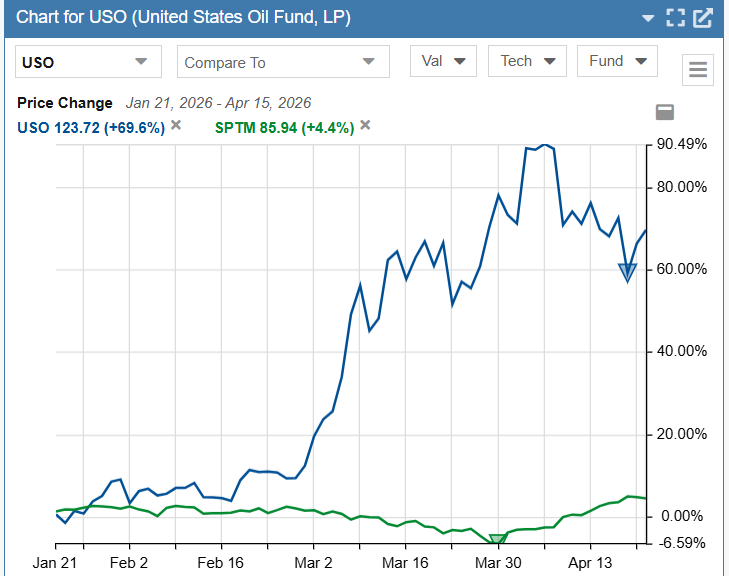
Of the eleven primary market sectors, this chart shows the top three and bottom three performers. I do it this way to keep things simple. Money has been flowing out of tech, consumer discretionary, and REITs, and into energy and financials. This trend will probably continue as long as demand for oil & gas remains high and interest rates continue to rise.

Chart 3. Styles - Growth vs. Value
After slightly underperforming growth last year, value is where the money is flowing. I see this as another durable trend. Growth has been hit hard by the slide in tech stocks this year.

Chart 4. Size
Small-caps are still lagging. After underperforming last year, they are struggling to keep up this year. Mid-caps were almost tied with large-caps last year, and they are in the lead this year. The flow of money from large-caps to mid-caps looks like a durable trend.

Chart 5. Factors
There are more than 100 factors to choose from, so I had to cut the list to just six in order to keep this chart reasonably easy to digest. Quality is getting pummeled this year after a stellar 2021. Mean reversion is at work.
The top performing factor so far is dividend yield. I'm not sure about the durability of this trend, because rising bond interest rates will begin to compete with dividends at some point.
The surprise, at least to me, is the relative outperformance of high beta stocks. My takeaway from this chart is that high beta does not necessarily go hand-in-hand with high growth or price momentum.

Chart 6. Sensitivity to the Business Cycle
In this chart, I divided the market sectors into two groups - those that respond more vigorously to the changing phases of the business cycle (cyclical), and those that respond less vigorously (defensive).
With the economy still in growth mode, cyclical stocks should do better than defensive stocks. That hasn't happened yet this year, and maybe the market is sending a signal that the economy isn't as strong as many would like to believe. The flow of money away from cyclicals and into defensive looks durable.

Chart 7. Bonds
I threw bonds into the mix because I have the data, and I think it might be interesting to watch how the various flavors of bonds react to Quantitative Tightening. So far it looks like convertible bonds are seeing the most outflows.
Keep an eye on junk bonds, because they are especially vulnerable to an economic slowdown. If they continue to lose momentum, the risk of recession will increase.

Chart 8. Countries
There are 50 countries that are represented by ETFs. Here are the top and bottom performers year-to-date. It looks like South America is having a resurgence this year, while Russia is struggling with geopolitical issues and heavy sanctions - both imposed and threatened.

Final Thoughts
2022 is only around 34 trading days old, so these numbers will undoubtedly shift as the year progresses. By keeping an eye on money flows among these categories, you can gain some insight into what could be a durable trend, and what's just noise.
The trends that look the most durable to me are foreign vs. US, value vs. growth, mid-cap vs. large- and small-cap, defensive vs. cyclical, and energy vs. tech.

Comments
Log in or sign up to join the conversation.