

Photo by Thomas Coker on Unsplash
Kiwi (NZDUSD) is in a very deep retracement down from June 2025 highs, but notice that the whole drop into the 78.6% is still unfolding in three waves. So ideally, it can be a deep counter-trend movement, maybe already in late stages, especially since we have seen another drop to a new low that looks like a potential ending diagonal. RBNZ cut interest, but while five members voted for another reduction in the cash rate, the updated statement and forecasts suggest the broader committee believes the nadir has been hit for the easing cycle, so the Kiwi is coming up as no room for cuts, for now. Notice it can be now bottoming after the wedge pattern into wave C, so if it manages to recover back to 0.58 area, then bulls can be back in the game.
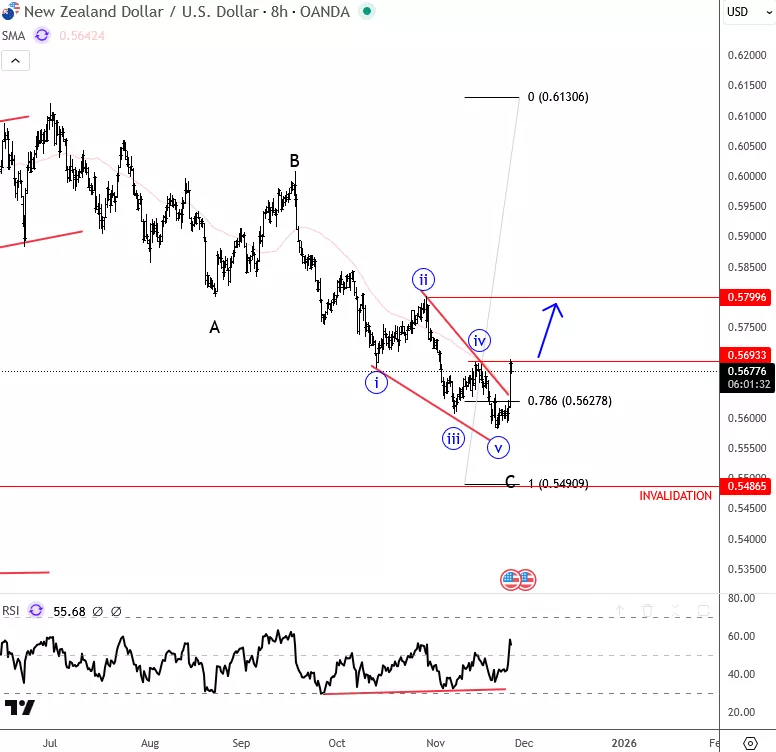
NZDUSD 4H Chart
Looking at the intraday chart, the Kiwi is nicely bouncing back above the upper wedge line after we spotted the final wave "v" of the wedge pattern. So, it seems like it's turning bullish, especially if we get a projected intraday five-wave impulse towards 0.57 area.
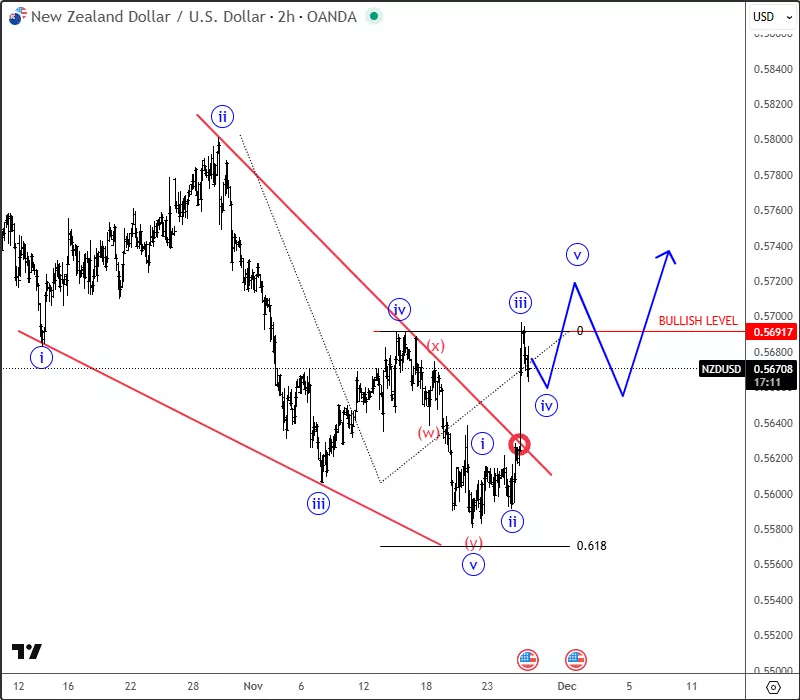
NZDUSD 2H Chart
Ending Diagonal
An ending diagonal is a wedge-shaped 5-wave pattern (1–2–3–4–5) appearing in wave 5 or C, signaling trend exhaustion, as price is struggling to resume lower.
Each wave subdivides into three smaller waves, with wave one and four overlaps as momentum fades.
It often ends with a sharp breakout in the opposite direction.
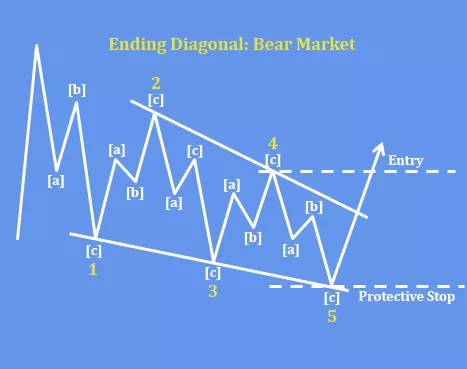
Basic Ending Diagonal / Wedge Pattern
More By This Author:
Alphabet Keeps Pushing Higher; Unfolding A Five-Wave Impulse
Elliott Wave: Dollar Can Come Down If Risk-On Returns
Netflix Is Finishing Its Correction After The Stock Split


Comments
Log in or sign up to join the conversation.