

The Japanese Yen is showing symptoms of a possible top being in-place, at least short-term. I had looked at this last Thursday as USD/JPY was starting to show some bullish potential with hints that a near-term bottom may be showing in the major pair.
That set up a short-term ascending triangle formation, very similar to the backdrop in DXY, and in early-week trade bulls have already forced a breakout to fresh weekly highs in the pair. This begs the question as to whether a bottom is in-place for both the US Dollar and USD/JPY, as USD/JPY has been one of the more attractive ways of working with the USD-strength theme since US Dollar bulls took control of the situation now more than a year ago.
USD/JPY Weekly Price Chart
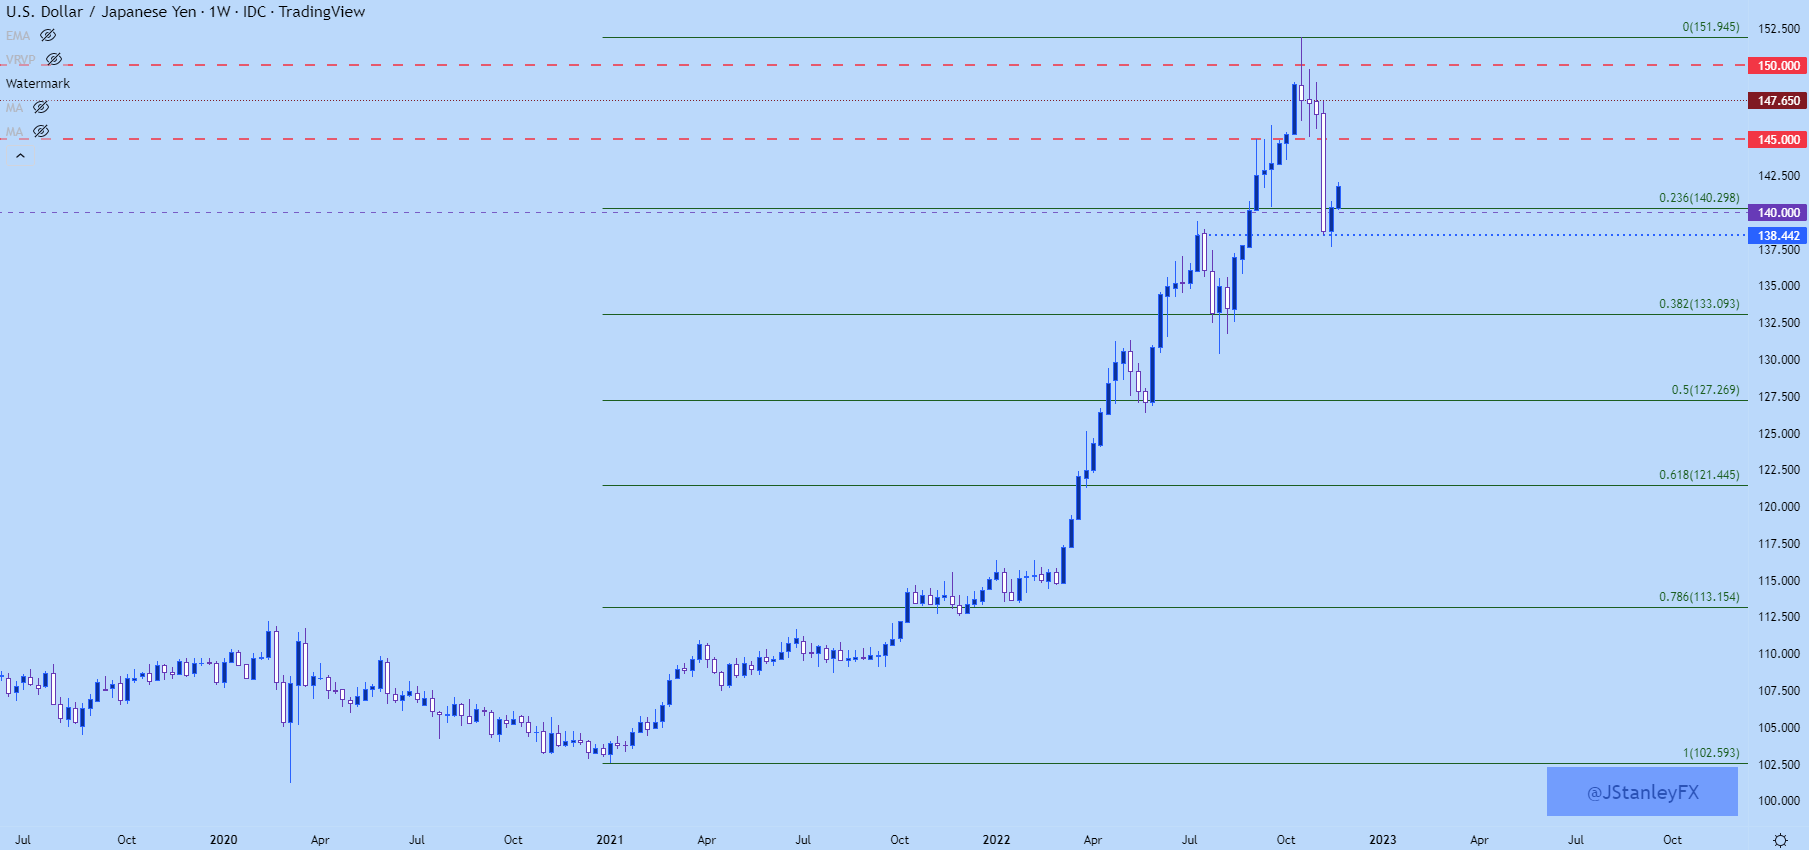
Chart prepared by James Stanley; USD/JPY on Tradingview
USD/JPY Shorter-Term
From a shorter-term perspective, USD/JPY is now working on holding the breakout at those fresh weekly highs. The first resistance level I had looked at in this week’s US Dollar forecast when discussing USD/JPY was at 141.45 and that’s already out; but it’s also too close to current price action to use as support.
The prior resistance from the ascending triangle remains of interest, however, and that plots at 140.80. A pullback to support there would keep price above the bullish trendline provided that it happens soon, and this would also be an element of support at prior resistance. If bulls can’t hold the move, however, there’s still support potential at the Fibonacci level of 140.30 or the psychological level of 140.00.
On the resistance side of the coin, I’m sticking with the same levels from this week’s USD forecast, and those plot at 142.50, 143.50 and then the 145.00 psychological level.
USD/JPY Four-Hour Price Chart
(Click on image to enlarge)
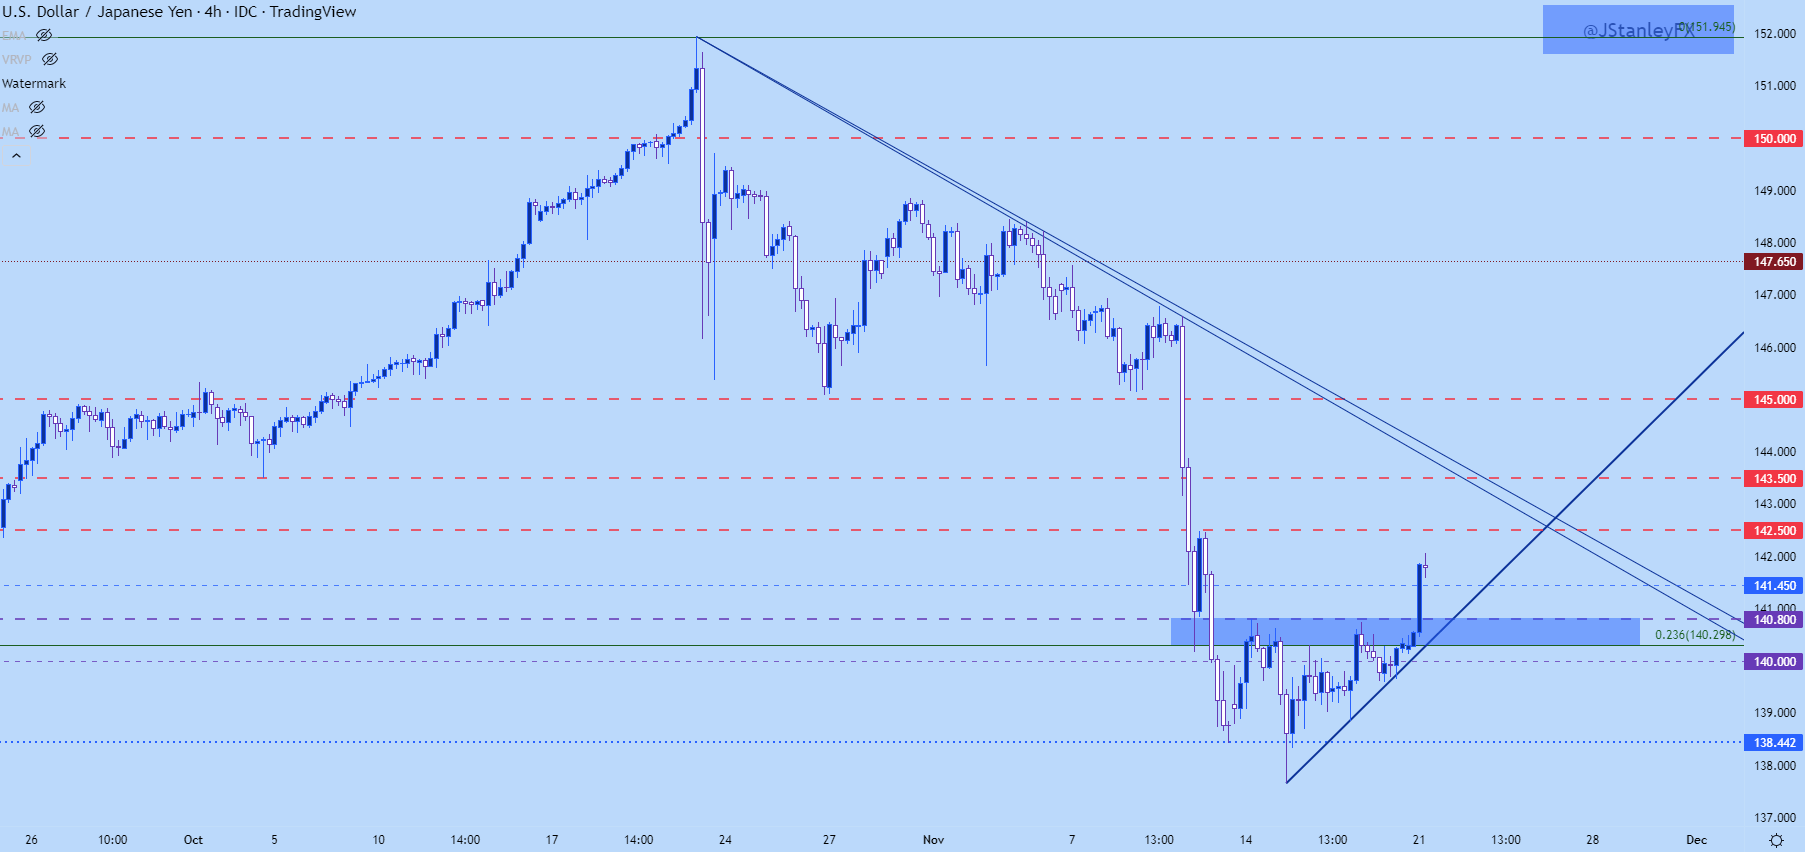
Chart prepared by James Stanley; USD/JPY on Tradingview
GBP/JPY
GBP/JPY has similar started the week with strength, pushing up to a fresh high at the 167.50 psychological level. Taking a step back, there’s been a massive move here over the past couple of months, drawing back to the collapse-like move in the British Pound in late-September.
When GBP fell with aggression, GBP/JPY came down to a major support level around the 149.00 handle. I had published an article that morning highlighting this fact, and that led to a strong rally in the pair and by the end of October GBP/JPY had gained more than 2,000 pips from that low.
But, life above the 170.00 psychological level wasn’t as friendly to bulls as life below was, and prices started pulling back and have continued to do so for much of November.
But, that pullback had some order to it, coming in as a falling wedge formation that also had the appearance of a bull flag formation. Price action started to grind out of that late last week and this week prices are bouncing from a bullish trendline to continue the move, with GBP/JPY getting back above the 167.20 area of prior resistance.
GBP/JPY Four-Hour Price Chart
(Click on image to enlarge)
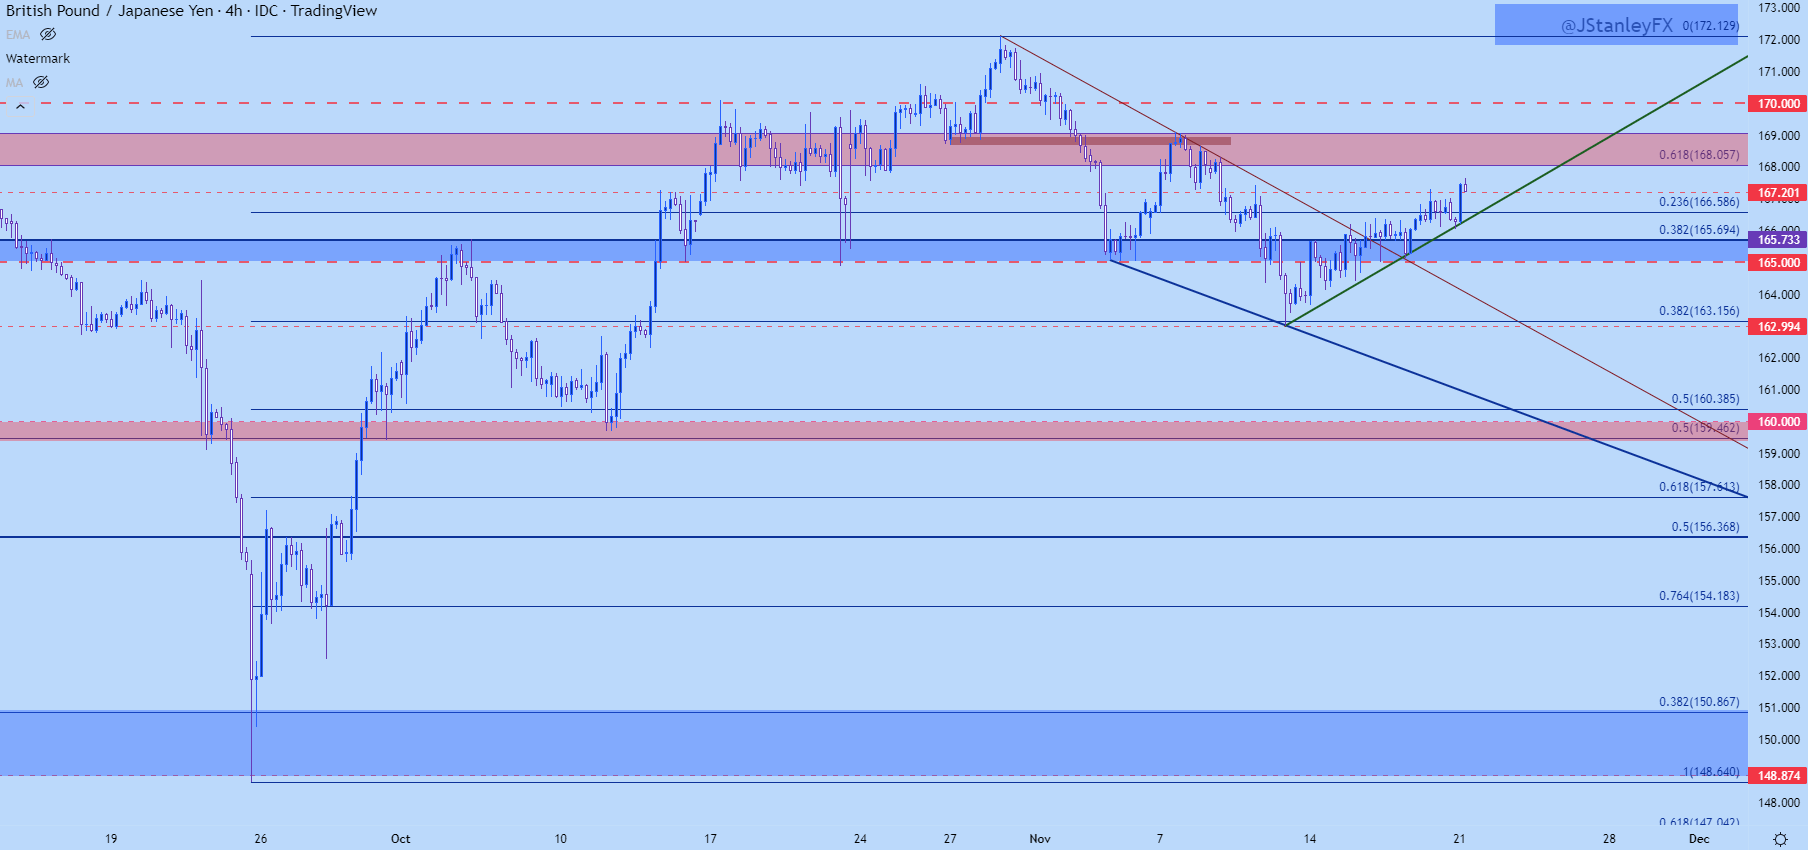
Chart prepared by James Stanley; GBP/JPY on Tradingview
GBP/JPY
Taking a step back on the chart and we can see that the breakout is still relatively fresh. And – GBP/JPY was up for five consecutive days last week with today’s daily bar being the sixth consecutive day of gains. While this doesn’t necessarily preclude continuation, it does highlight caution, and it puts attention back on higher-low support potential at an area such as 166.59 or perhaps even down to the 165.69 level.
On the topside of price action, a major spot of resistance is around the 168.06 level with another around 169 and above that the 170.00 handle comes into the picture. Given the proximity to that batch of confluent resistance points, chasing the trend could be problematic which is why the focus on support remains of interest.
GBP/JPY Daily Chart
(Click on image to enlarge)
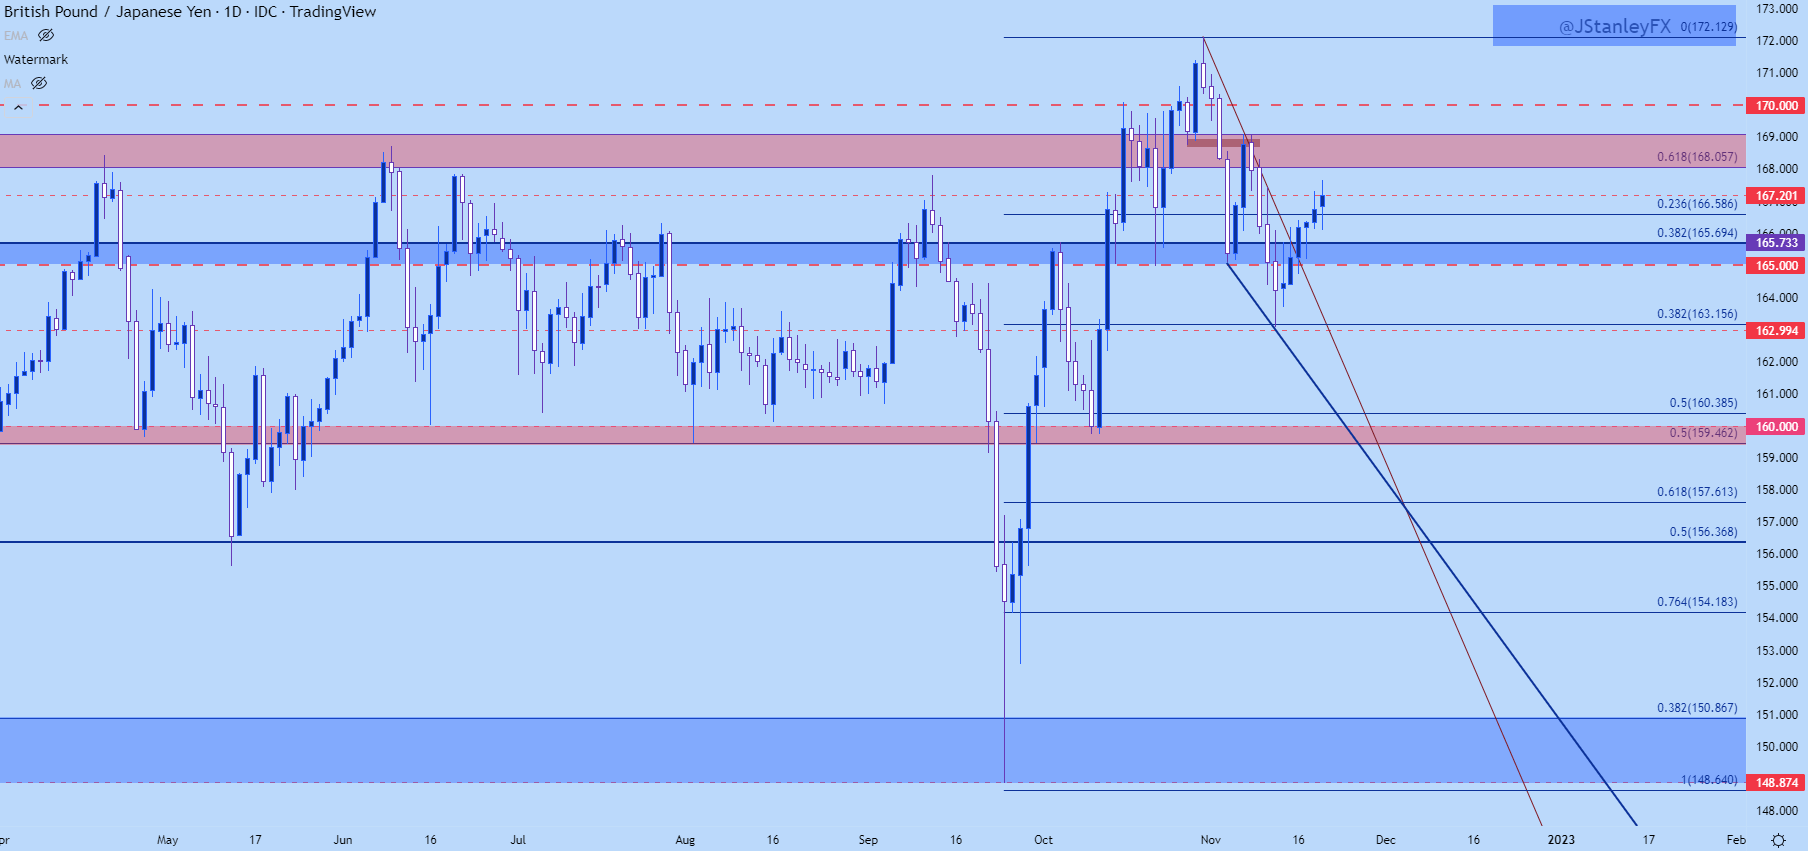
Chart prepared by James Stanley; GBP/JPY on Tradingview
EUR/JPY
EUR/JPY hasn’t broken out from short-term formations yet and this can mean two things. First, for those looking to fade this Yen-weakness, the laggard pair of EUR/JPY may be a more interesting candidate than what we looked at above in either USD/JPY or GBP/JPY. So, for those looking to play swing reversals, EUR/JPY may be enticing as it hasn’t quite shown the same element of Yen-weakness at this point.
But, for those that are on-board with and looking for Yen-weakness to continue, EUR/JPY can be of interest as the breakout hasn’t really taken place there. From the four-hour chart, we can see a similar ascending triangle that’s already cleared in USD/JPY.
EUR/JPY Four-Hour Price Chart
(Click on image to enlarge)
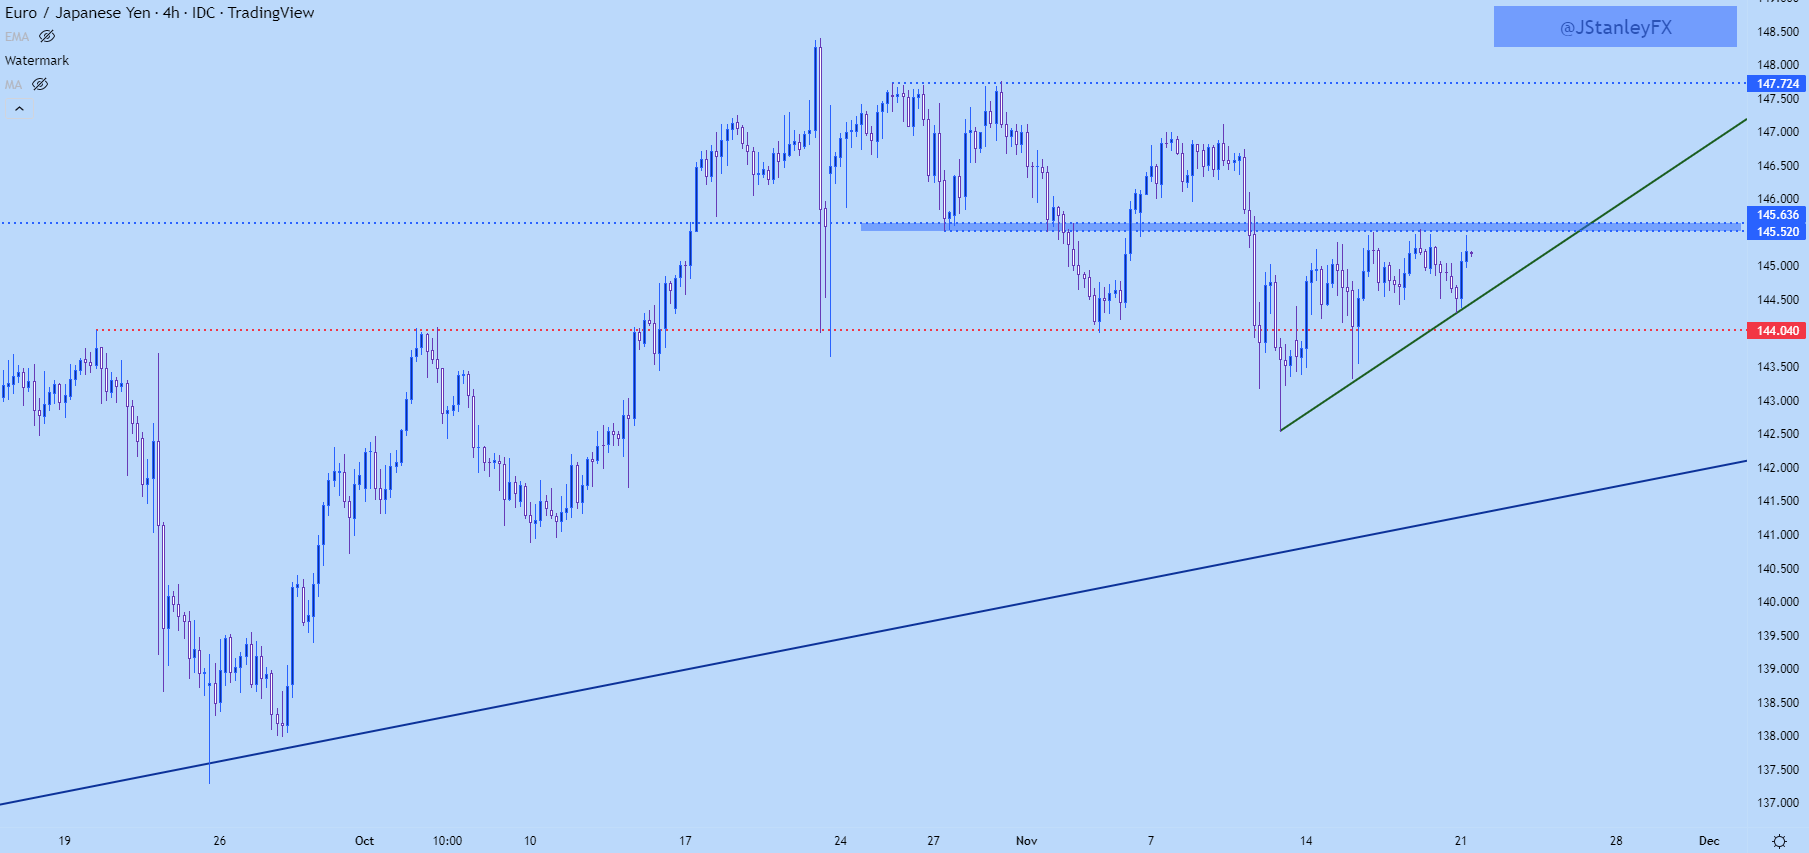
Chart prepared by James Stanley; EUR/JPY on Tradingview
EUR/JPY LONGER-TERM
Taking a step back to the daily chart and we can see that bulls haven’t really been as forceful as they have in either of the above two markets. There’s been a series of wicks on the underside of candles in early trade last week, which turned into wide candles on the topside of the daily bars later in the week. So, while bulls have tried to push prices higher they’ve also been offset by sellers that have kept the breakout from happening at this point.
For bears, this is likely the key takeaway, that bulls haven’t yet been able to take out resistance. And, even if they do finally budge above that high – will they be able to prod a continued move, as there’s more resistance sitting overhead?
At this stage there’s a near-term resistance zone at 145.52-145.64 and above that is a prior swing-low that’s confluent with a bearish trendline, which I’m tracking around 146.32. So, if bulls do force a breakout and if resistance shows in that area, the door can open to fades. Alternatively, a breach of short-term support around the 144 level can open the door for shorts.
EUR/JPY Daily Price Chart
(Click on image to enlarge)
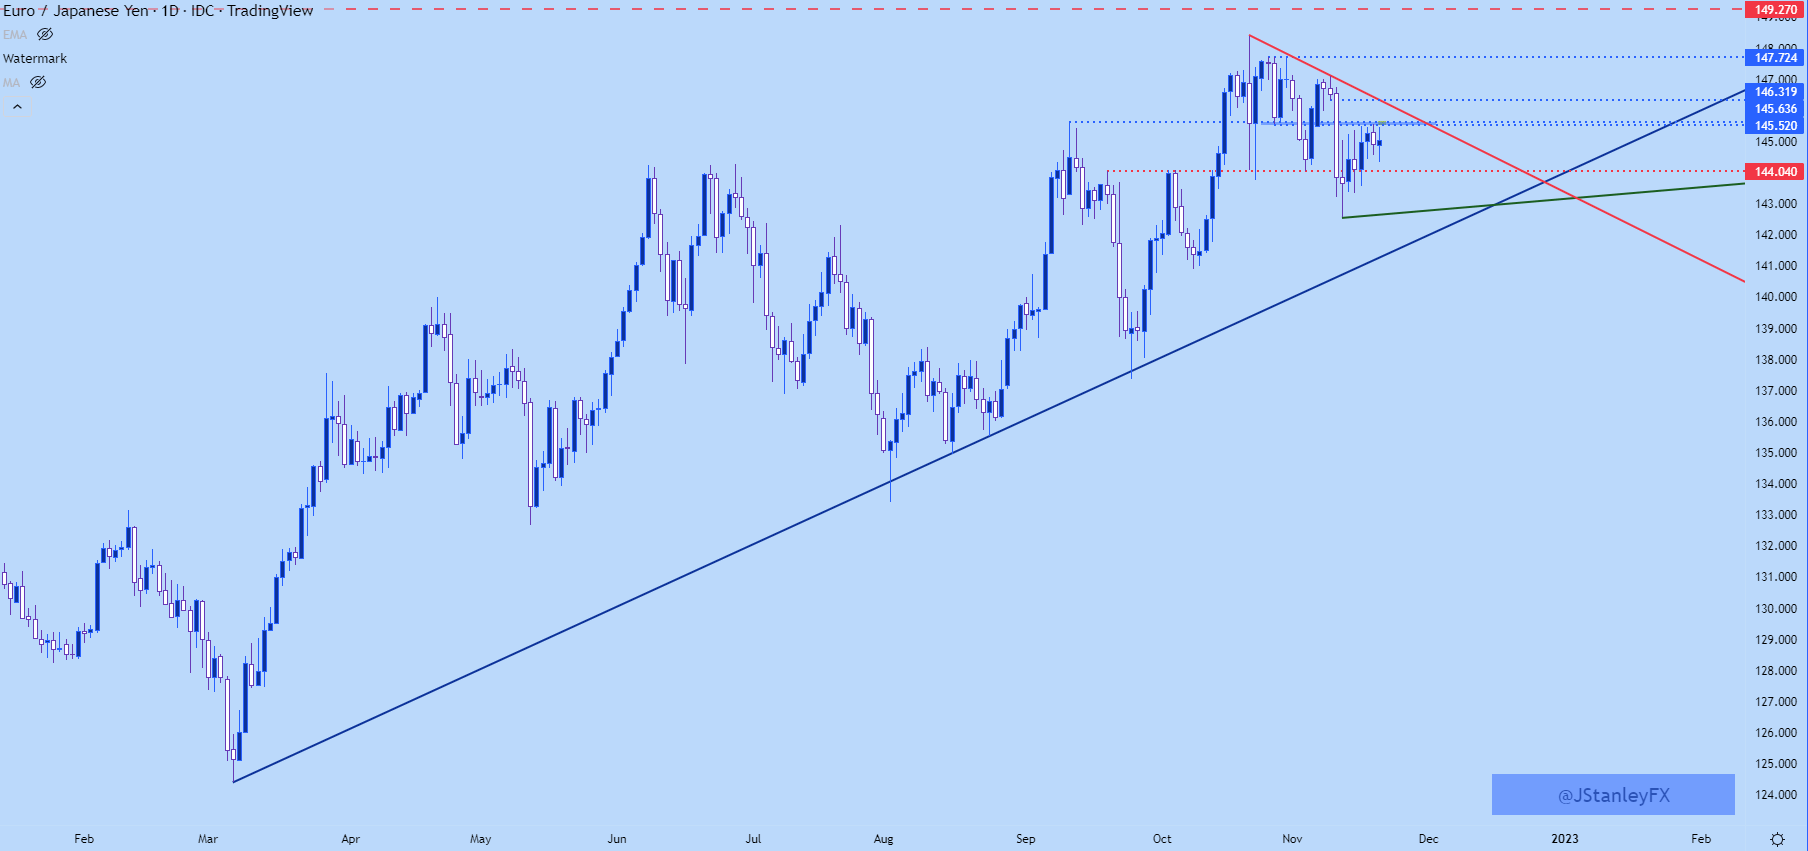
Chart prepared by James Stanley; EUR/JPY on Tradingview
More By This Author:
S&P 500 Holds Support, Builds Wedge Ahead Of OpEx
Canadian Dollar Price Action Setups: USD/CAD, CAD/JPY, EUR/CAD
EUR/USD Tests Key Resistance At 1.0350, Can Bulls Further The Move?


Comments
Log in or sign up to join the conversation.