
The Canadian Dollar continued to strengthen against the US Dollar through last week and USD/CAD plunged through the 1.3350 zone, with the fall continuing on Friday until price came very near a key point of prior resistance. The psychological level at 1.3250 helped to hold the lows last week and so far this week, that’s remained the case.
This is notable because yesterday saw a quick breach of support in DXY that quickly faded, but USD/CAD held above the 1.3224 spots. This keeps the door open for bounce potential, particularly if USD-strength themes start to re-appear. Today’s daily bar will be key for this theme, as a hold of support would also need to be accompanied by some element of response from bulls, or else the probability of another support breach increases.
USD/CAD Daily Price Chart
(Click on image to enlarge)
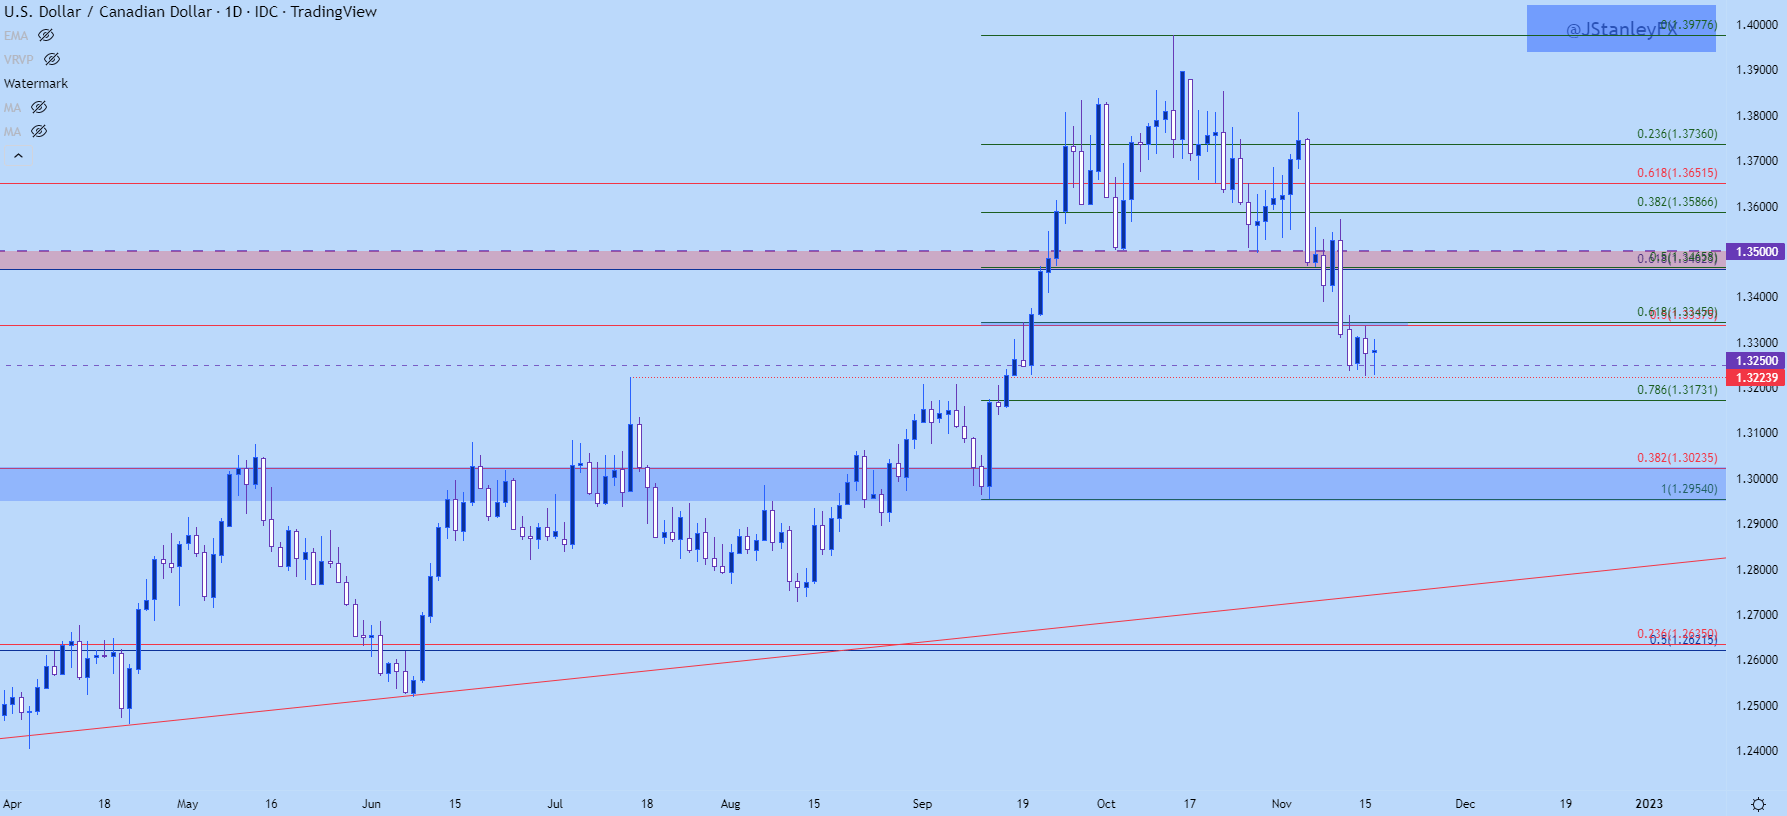
Chart prepared by James Stanley; USDCAD on Tradingview
USD Reference
As a comparison, I wanted to look at the US Dollar chart to illustrate the difference in lows from yesterday. While USD/CAD held support at the same spot that was in play last Friday, the Greenback slid down to a fresh low before quickly reversing. This of course was driven by the headlines around a missile landing in Poland and the bearish trend returned after the price had pushed up to the Fibonacci level at 107.08.
The direct takeaway is that a bit of Canadian Dollar weakness has helped to hold USD/CAD above support even as DXY sank to a fresh low early yesterday. This, again, points to the potential for pullbacks if we do get to a stage of USD strength returning.
There are other extrapolations that can be taken from this deduction, which I’ll look at below.
US Dollar Daily Price Chart
(Click on image to enlarge)
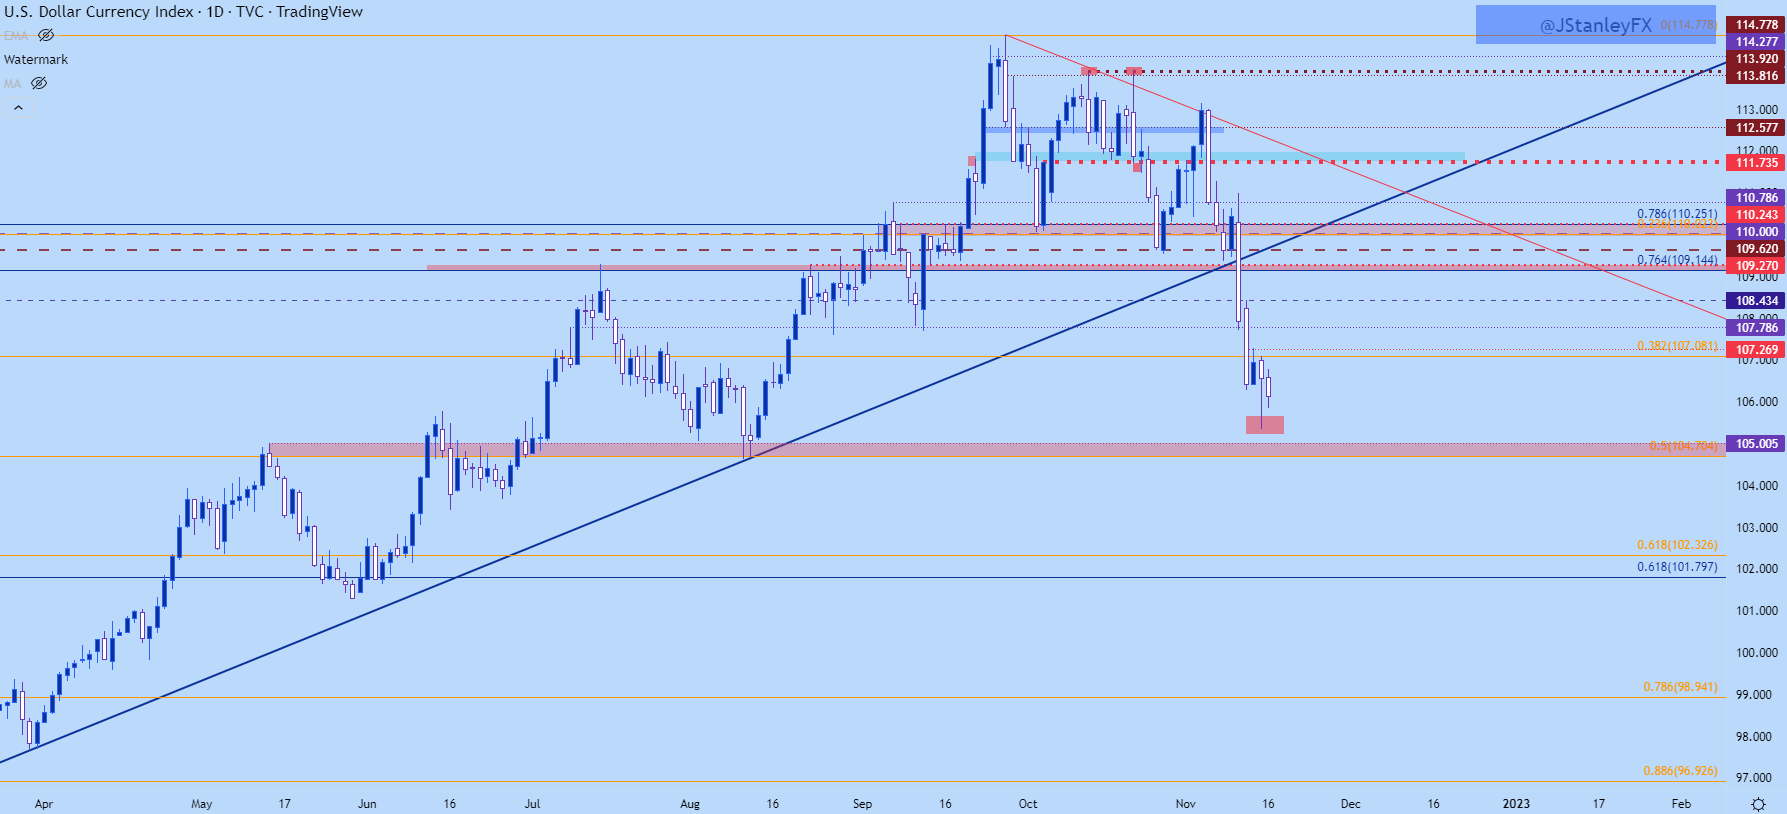
Chart prepared by James Stanley; USD, DXY on Tradingview
CAD/JPY
When I looked into the Canadian Dollar last week the currency was in a similar spot, at least against the US Dollar. Price had pushed down to support and it hadn’t broken yet – but the USD was already very weak on a short-term basis. But, the longer-term trend took over with another major push on Thursday following the release of CPI data in the US, and the USD plunged through a number of supports as EUR/USD and GBP/USD surged, USD/CAD dropped right through the next support at 1.3350 until eventually slowing the decline around the 1.3250 psychological level.
But, as I had shared then, there were areas in CAD/JPY or even EUR/CAD that may present more interest for CAD-weakness scenarios.
Regarding CAD/JPY, I said last week ‘A break below that (106.81) opens the door for a move down towards the 1.0500 psychological level and if sellers can evoke a deep enough push, a breach of 104.57 opens the door to a bigger picture reversal scenario.’
A little more than a week later and that breakout took place last Thursday, with the price now sitting on that 104.57 level, which is similar to 1.3250 in USD/CAD, has been in play every day since last Friday.
This keeps the door open for similar support bounce potential but there’s an important difference in CAD/JPY: Lower-highs over the past three trading days. So, even as bulls have tried to pose a bounce, sellers have been there to swat down the advance. This isn’t quite a descending triangle but it has similar tonality, and if sellers can keep up the sequence of lower highs the door for deeper breakdown remains open. The next support level down is a Fibonacci level of around 103.73. A break above 105.66 which was yesterday’s high breaks the sequence, and makes the probability of a support bounce look more likely as bulls would’ve shown some element of control after support had come into play.
CAD/JPY Daily Price Chart
(Click on image to enlarge)
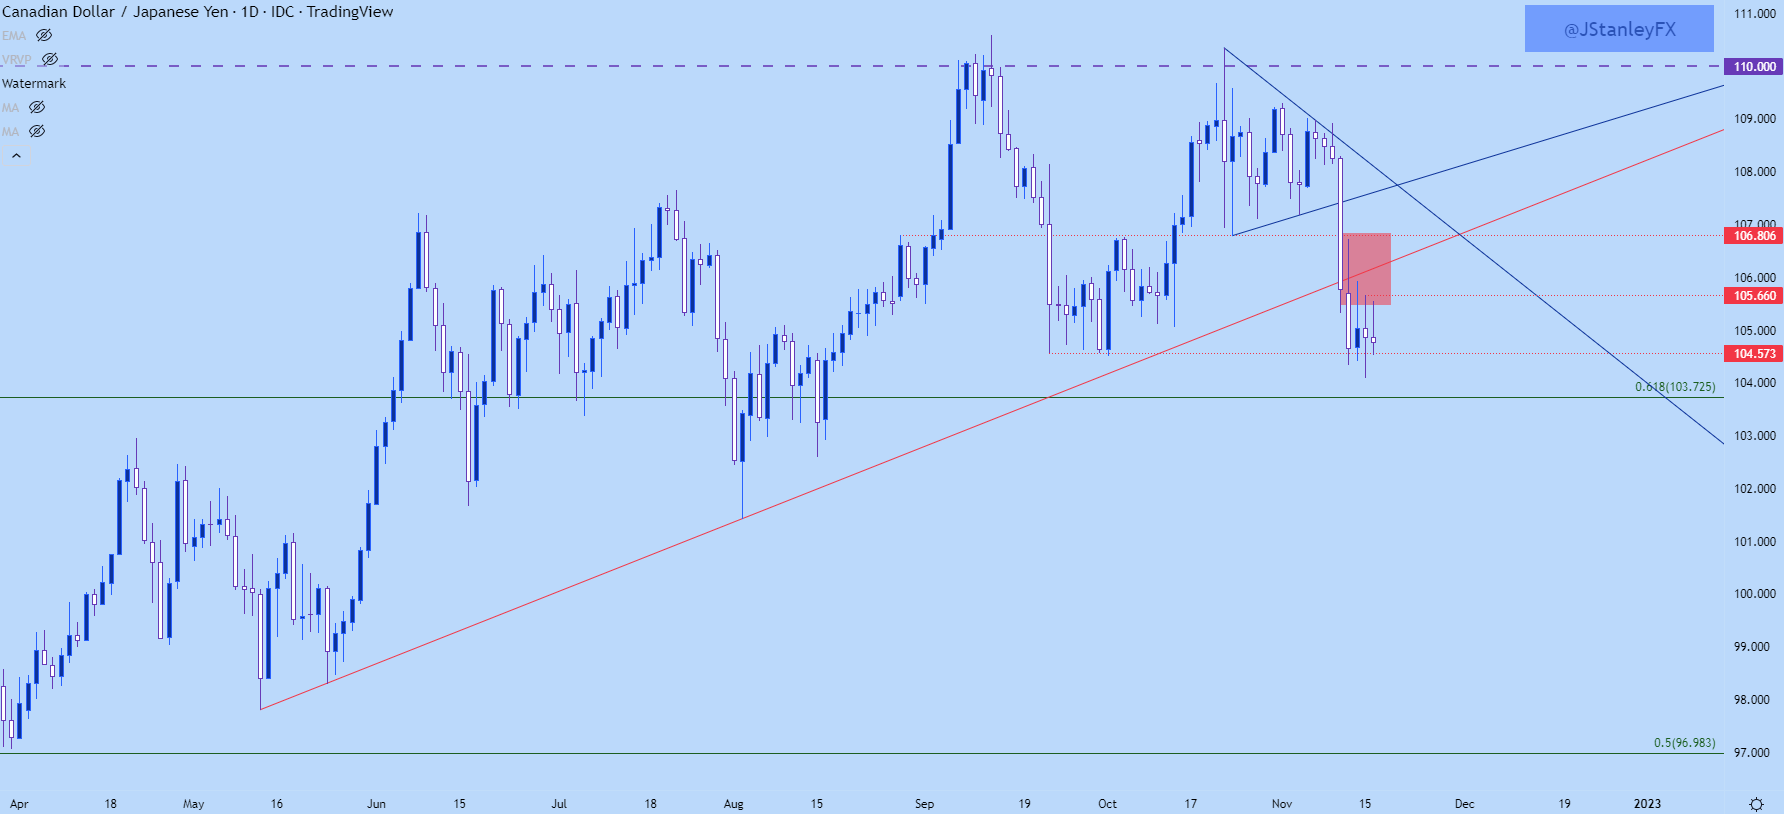
Chart prepared by James Stanley; CADJPY on Tradingview
EUR/CAD
Similarly, CAD weakness was showing more prominence in EUR/CAD than USD/CAD last week. As I had highlighted last week, EUR/CAD was working on a breakout at the 200-day moving average. That level was confluent with a 61.8% Fibonacci retracement and there was a longer-term trendline sitting overhead.
The breakout there took hold on Thursday and has since continued up to fresh seven-month-highs. Yesterday’s price action showed as a doji at the highs which, normally, would start to open the door to fade scenarios. But, bulls have come right back into the matter after yesterday’s low printed right at prior resistance and the door for continued topside action remains open.
But, if bulls fail to take out yesterday’s high over the next couple of days, and we get a build of lower highs, the breakout will start to look vulnerable and this could re-open the door for bearish themes in the pair.
EUR/CAD Daily Price Chart
(Click on image to enlarge)
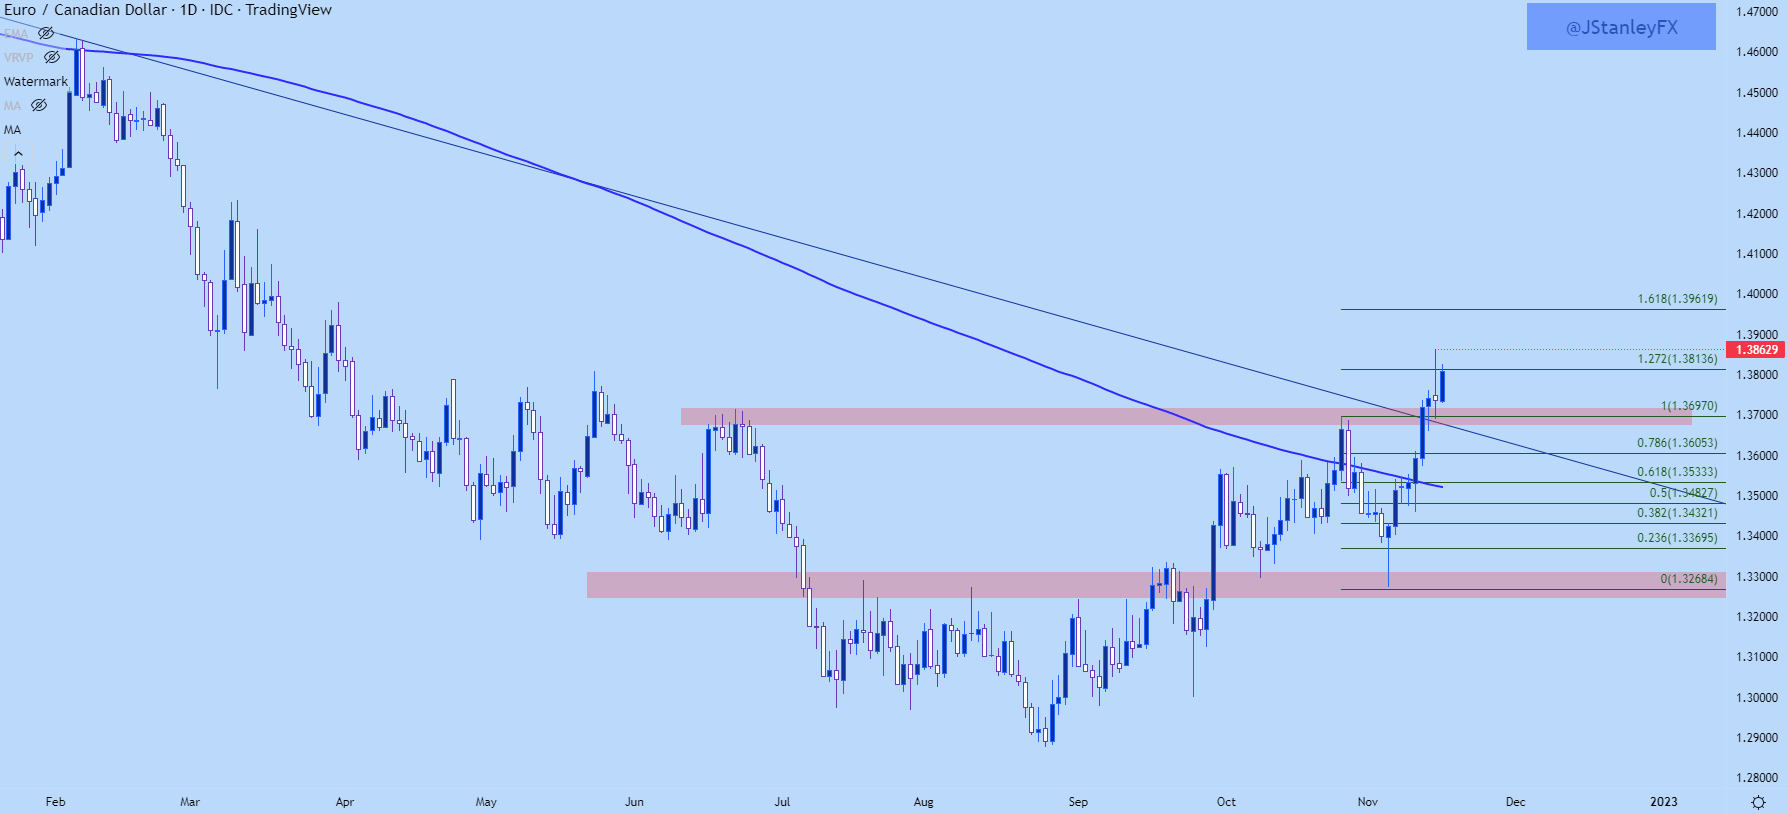
Chart prepared by James Stanley; EURCAD on Tradingview
More By This Author:
EUR/USD Tests Key Resistance At 1.0350, Can Bulls Further The Move?Bitcoin Falls, ETH Tests Support On Fears Of Cascading Crypto Crisis After FTX BK
USD Slammed, Gold And EURUSD Jump After CPI


Comments
Log in or sign up to join the conversation.