
STATE BANK OF INDIA Elliott Wave Analysis – Trading Lounge Day Chart
STATE BANK OF INDIA Elliott Wave Technical Analysis
FUNCTION: Counter Trend
MODE: Corrective
STRUCTURE: Orange Wave 2
POSITION: Navy Blue Wave 5
DIRECTION NEXT HIGHER DEGREES: Orange Wave 3
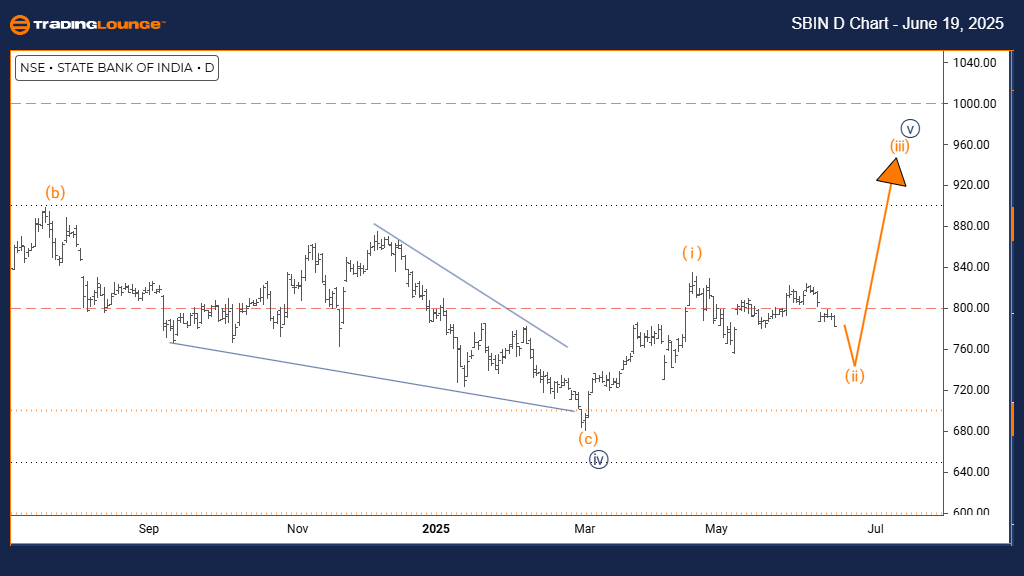
DETAILS: Orange Wave 1 appears complete; Orange Wave 2 is now developing.
The Elliott Wave daily analysis for STATE BANK OF INDIA indicates a counter-trend setup, showing corrective price movement as part of a temporary retracement. This retracement fits within a broader trend. The chart identifies this phase as Orange Wave 2, forming inside a larger structure that belongs to Navy Blue Wave 5. This pattern suggests the stock is experiencing a regular pullback and may resume its main direction afterward.
Orange Wave 1 looks complete, transitioning into Orange Wave 2. This marks a typical corrective step, often retracing part of the Orange Wave 1 move. The expected next phase in the higher-level structure is Orange Wave 3. This would begin after Orange Wave 2 ends and may continue the overall counter-trend.
Current technical signals show STATE BANK OF INDIA progressing through Orange Wave 2 after completing Orange Wave 1. The corrective behavior implies possible sideways movement or light pullbacks before any trend resumes. The stock's location within Navy Blue Wave 5 aligns with it being in a continuing corrective phase.
Traders are advised to observe Orange Wave 2 for signs of conclusion, as this will set up the conditions for the potential start of Orange Wave 3. Given the counter-trend formation, short-term price consolidation may occur before the next move appears in the stock’s action.
STATE BANK OF INDIA Elliott Wave Analysis – Trading Lounge Weekly Chart
STATE BANK OF INDIA Elliott Wave Technical Analysis
FUNCTION: Bullish Trend
MODE: Impulsive
STRUCTURE: Navy Blue Wave 5
POSITION: Gray Wave 5
DIRECTION NEXT HIGHER DEGREES: Navy Blue Wave 5 (in progress)
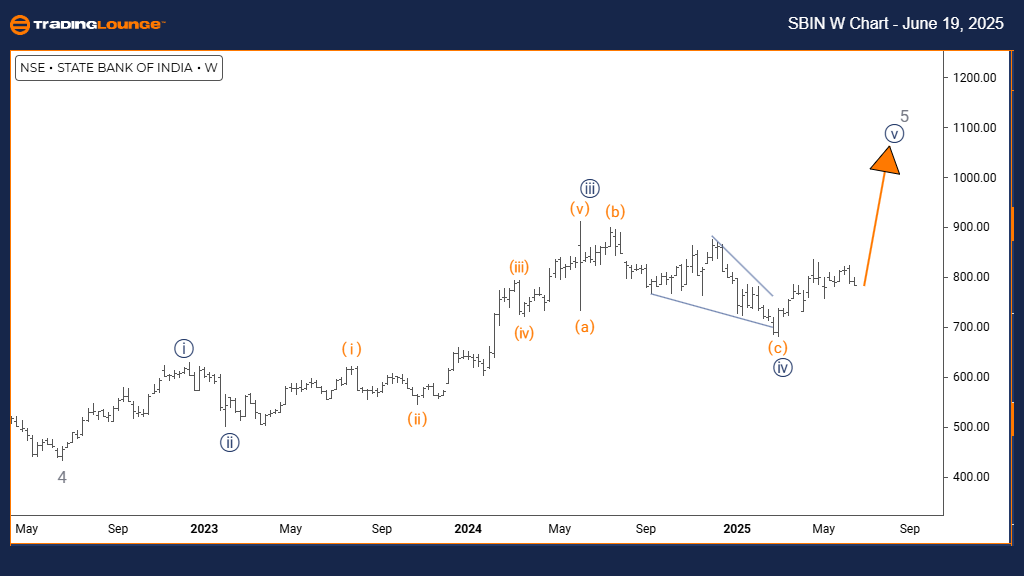
DETAILS: Navy Blue Wave 4 appears completed; Navy Blue Wave 5 is underway.
The Elliott Wave analysis for STATE BANK OF INDIA on the weekly chart reveals a bullish trend. The price is moving in an impulsive pattern, indicating continued upward strength. The current wave is Navy Blue Wave 5, forming as part of a larger structure known as Gray Wave 5. This setup shows the stock may be entering the final stages of a broader advancing wave cycle.
The analysis confirms that Navy Blue Wave 4 has likely ended, shifting into Navy Blue Wave 5. This phase is usually the final leg in an Elliott Wave impulse sequence, often showing strong price movement. Traders should now focus on tracking Navy Blue Wave 5 within the Gray Wave 5 framework.
Current indicators point to continued upward potential for STATE BANK OF INDIA. With Navy Blue Wave 5 active after the completion of Navy Blue Wave 4, momentum could remain strong. However, since this is a fifth wave in a broader wave structure, traders should watch for any signs of trend exhaustion or possible reversal.
Technical Analyst: Malik Awais
More By This Author:
Elliott Wave Trading SP500, Nasdaq 100, DAX 40, FTSE 100 & ASX 200
Unlocking ASX Trading Success: Cochlear Limited - Wednesday, June 18
Elliott Wave Technical Analysis: Wheat - Wednesday, June 18


Comments
Log in or sign up to join the conversation.