
Indian Stocks ITC Limited
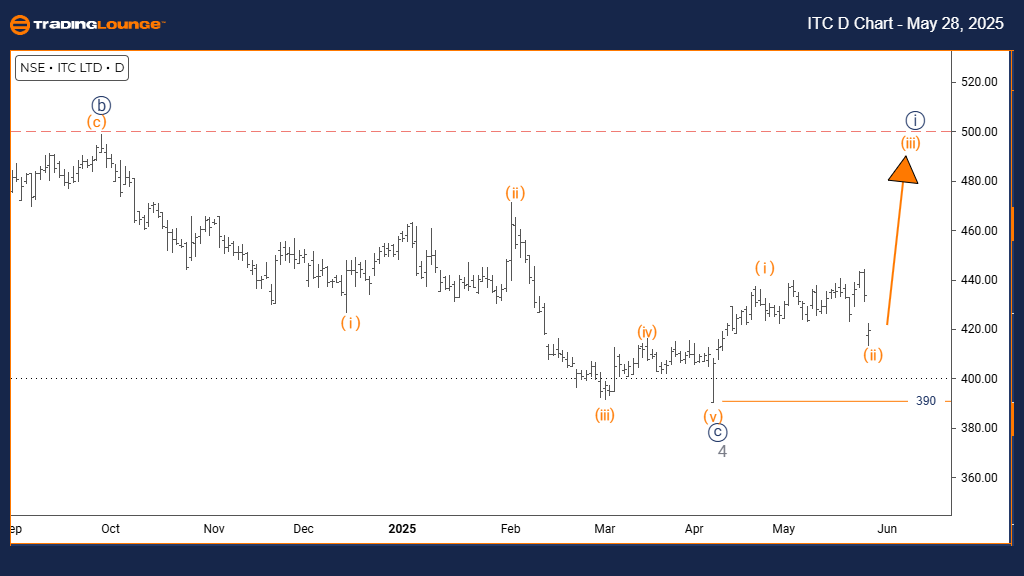
ITC INDIA – Elliott Wave Analysis – Trading Lounge Day Chart
ITC India – Wave Technical Analysis
FUNCTION: Bullish Trend
MODE: Impulsive
STRUCTURE: Orange Wave 3
POSITION: Navy Blue Wave 1
DIRECTION (NEXT HIGHER DEGREES): Orange Wave 3 (initiated)
Wave Cancel Invalid Level: 390
DETAILS: With orange wave 2 completed, orange wave 3 is now in progress.
The daily chart of ITC India indicates strong upward momentum, marking an established bullish trend. Orange wave 3 is evolving within a broader bullish cycle identified as navy blue wave 1. This suggests that orange wave 2's correction has ended and the stock is now in one of the most energetic phases of an Elliott Wave impulse.
The impulsive characteristics of wave 3 indicate strong buying support. Being positioned inside navy blue wave 1 enhances the possibility of further gains. A critical invalidation level is set at 390; falling below this threshold would challenge the current wave structure and could hint at a larger correction or a change in trend.
This technical model offers investors a detailed view of ITC's broader market context. It suggests continued bullish movement is likely in the short term. The development of orange wave 3 within navy blue wave 1 could produce considerable upside potential before the next pullback.
Investors should track price activity for confirmation of wave 3’s continuation while watching the 390 level as a key support. Staying above this level will reinforce the bullish projection.
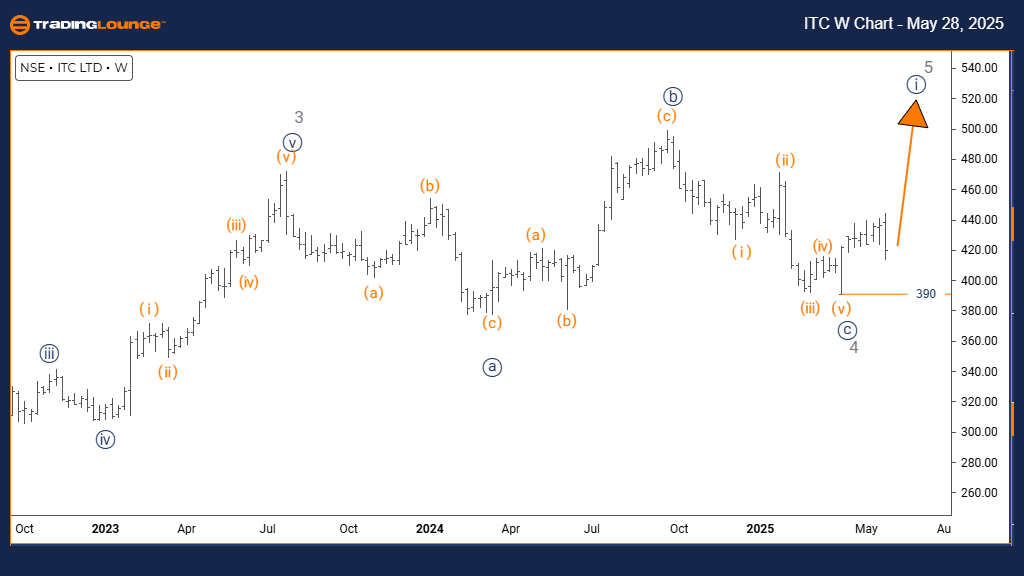
ITC INDIA – Elliott Wave Analysis – Trading Lounge Weekly Chart
ITC India – Wave Technical Analysis
FUNCTION: Bullish Trend
MODE: Impulsive
STRUCTURE: Navy Blue Wave 1
POSITION: Gray Wave 5
DIRECTION (NEXT LOWER DEGREES): Navy Blue Wave 2 (expected)
Wave Cancel Invalid Level: 390
DETAILS: Completion of gray wave 4 suggests navy blue wave 1 of gray wave 5 is now active.
The weekly ITC India chart maintains a bullish outlook as the stock enters what may be the final impulse wave of its current cycle. Navy blu
e wave 1 is forming within gray wave 5, signaling the end of gray wave 4’s correction and the start of a new advancing move. This typically represents the final leg before a broader reversal or consolidation.
The impulsive characteristics of navy blue wave 1 highlight strong demand and continued bullish sentiment. However, since this wave belongs to the final gray wave 5, it may also suggest a nearing end of the longer bullish trend. A critical support at 390 marks the invalidation level; a breach here would question the current structure.
Long-term investors can use this analysis to understand ITC’s current placement within the broader market cycle. While the stock shows remaining upside, it’s in a phase that historically leads into correction. The next movement, navy blue wave 2, is expected once the current impulse completes.
Traders should watch for indications of wave 1’s completion and monitor the 390 level closely. The weekly chart stresses the importance of managing exposure as the stock approaches elevated levels within a wave 5 structure.
Technical Analyst: Malik Awais
More By This Author:
Unlocking ASX Trading Success: Cochlear Limited - Wednesday, May 28
Elliott Wave Technical Analysis: Australian Dollar/Japanese Yen - Wednesday, May 28
Neo Crypto Price News Today
At TradingLounge™, we provide actionable Elliott Wave analysis across over 200 markets. Access live chat rooms, advanced AI & algorithmic charting tools, and curated trade ...
more

