

Image Source: Unsplash
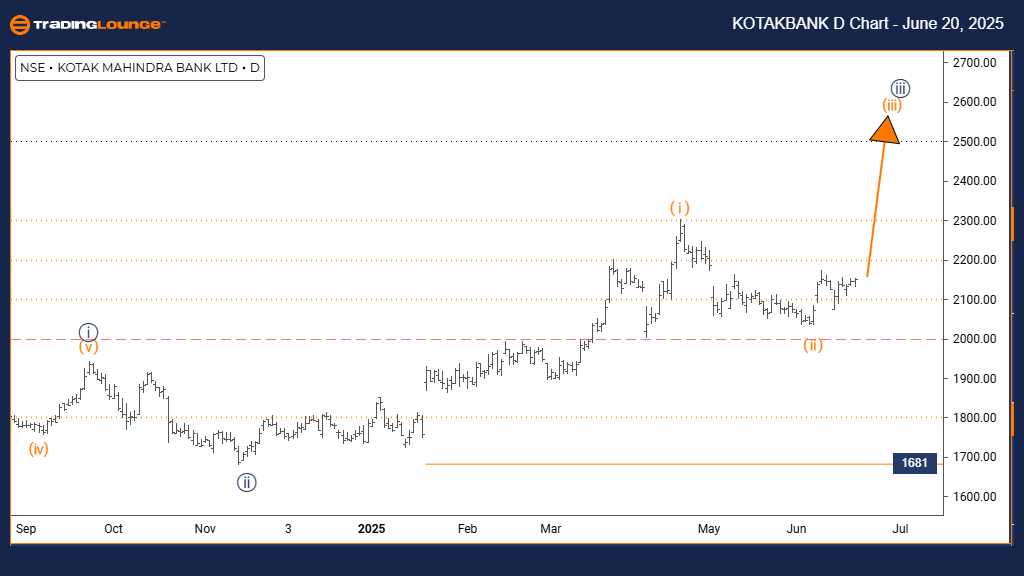
KOTAK BANK Elliott Wave Analysis | Trading Lounge Day Chart
KOTAK BANK Elliott Wave Technical Analysis
FUNCTION: Bullish Trend
MODE: Impulsive
STRUCTURE: Orange wave 3
POSITION: Navy blue wave 3
DIRECTION NEXT LOWER DEGREES: Orange wave 4
DETAILS: Orange wave 2 seems completed; orange wave 3 is currently unfolding.
Wave Cancel Invalid Level: 1681
The KOTAK BANK daily chart Elliott Wave analysis shows a bullish setup. Price action is moving in an impulsive mode, signaling upward strength. The current pattern indicates orange wave 3 is in progress, forming part of the larger navy blue wave 3. This setup indicates the stock is in a major advancing phase within a broader bullish trend.
Orange wave 2 appears to have finished its corrective movement, marking the start of orange wave 3. Typically, this wave produces strong gains as it’s usually the most extended in the Elliott Wave cycle. Following the completion of orange wave 3, a pullback is expected in the form of orange wave 4.
The invalidation level for this wave count is at 1681. A drop below this level would challenge the current bullish outlook and would require re-evaluation of the analysis. As long as the price remains above 1681, the bullish trend and upward momentum remain valid.
Overall, KOTAK BANK appears positioned for further upward movement. With orange wave 3 now active, strong buying interest is implied, and higher prices are expected.
(Click on image to enlarge)
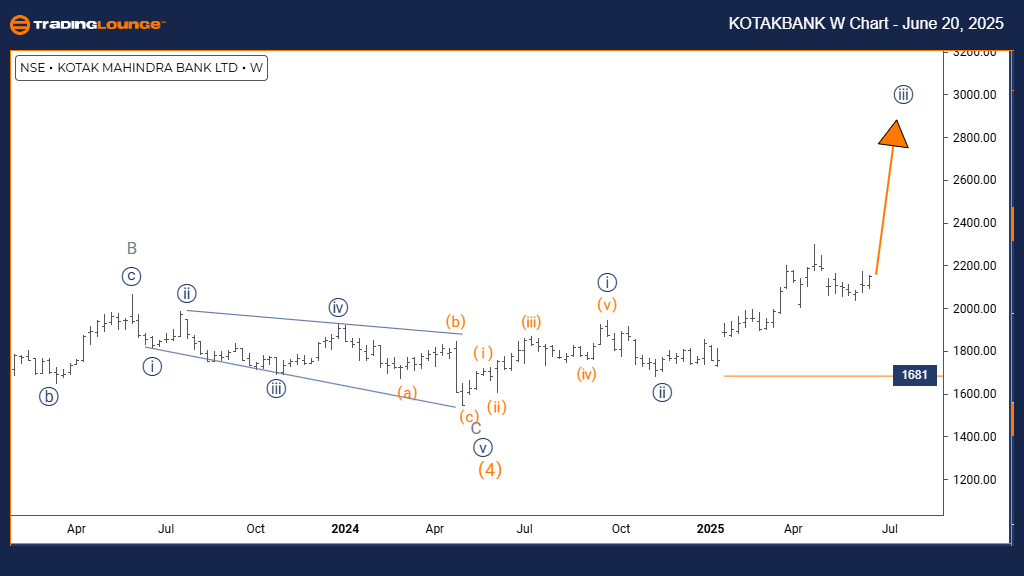
KOTAK BANK Elliott Wave Analysis | Trading Lounge Weekly Chart
KOTAK BANK Elliott Wave Technical Analysis
FUNCTION: Bullish Trend
MODE: Impulsive
STRUCTURE: Navy blue wave 3
POSITION: Gray wave 1
DIRECTION NEXT LOWER DEGREES: Navy blue wave 3 (started)
DETAILS: Navy blue wave 2 appears completed; navy blue wave 3 is now developing.
Wave Cancel Invalid Level: 1681
The KOTAK BANK weekly chart Elliott Wave analysis indicates a bullish trend. Price action is progressing in impulsive mode, suggesting continued upward strength. The wave structure shows navy blue wave 3 in play, which forms part of the broader gray wave 1. This pattern places the stock in the early stages of a broader bullish cycle.
With navy blue wave 2 completed, the market has transitioned into navy blue wave 3. This wave typically brings strong and sustained momentum as it is often the most dynamic in the Elliott sequence. The next key move within lower degrees will continue inside navy blue wave 3 as it develops its internal structure.
The wave cancelation level is at 1681. If the price drops below this level, the current bullish setup would be invalidated and the analysis would need to be re-evaluated. As long as the price stays above 1681, the bullish scenario remains intact.
The technical setup supports a medium-term bullish outlook for KOTAK BANK. With navy blue wave 3 now in progress, the price is expected to trend higher, driven by sustained buying interest within the structure of gray wave 1.
(Click on image to enlarge)
More By This Author:
Elliott Wave Technical Analysis: Vechain Crypto Price News For Friday, June 20
Elliott Wave Technical Forecast: Newmont Corporation - Thursday, June 19
Elliott Wave Technical Analysis: IBEX 35 - Thursday, June 19


Comments
Log in or sign up to join the conversation.