Elliott Wave Technical Analysis: Vechain Crypto Price News For Friday, June 20

Image Source: Pixabay
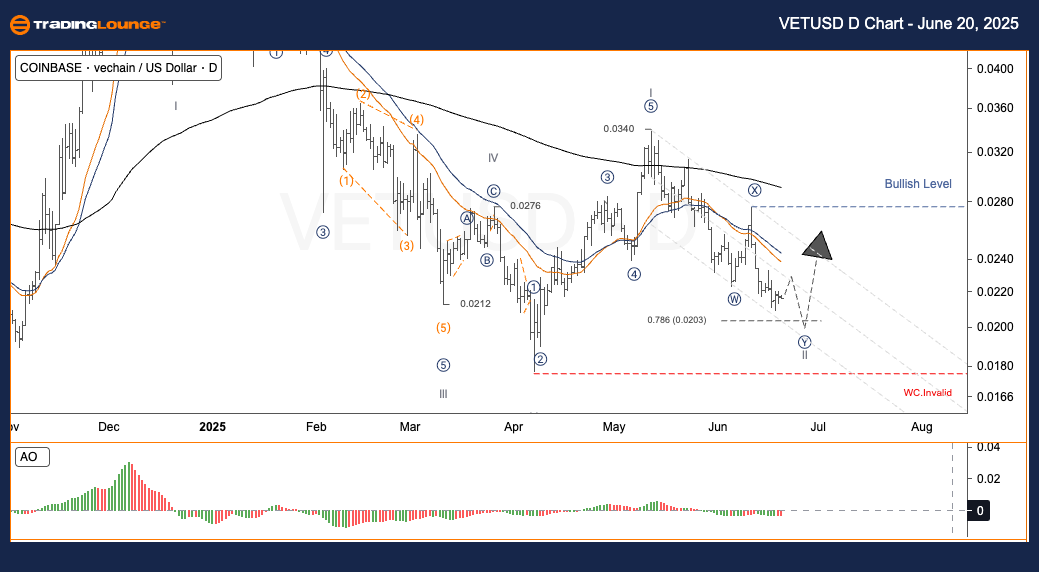
Elliott Wave Analysis - TradingLounge Daily Chart, Vechain / U.S. Dollar (VETUSD)
VETUSD Elliott Wave Technical Analysis
- Function: Counter trend
- Mode: Corrective
- Structure: Double Corrective
- Position: Wave Y
- Next Direction Higher Degree: Pending
- Wave Cancel Invalid Level: Under Review

Vechain / U.S. Dollar (VETUSD) - Trading Strategy:
The VET/USD pair appears to be nearing the end of Wave II, which is a part of the corrective structure. If the price drops close to the 0.020 – 0.018 range and then shows a sharp upward move, it would indicate the potential beginning of an impulsive Wave III to the upside.
Trading Strategies:
- General Approach
-
- Short-Term Traders (Swing Trading)
-
- ✅ Monitor RSI/MACD for divergence and ensure the price does not form a new confirmed low.
- ✅ If a reversal candlestick such as a Bullish Engulfing appears with supporting volume, consider initiating buy positions.
- Risk Management
-
- 🟥 If the price drops below 0.01700, the Wave II structure becomes invalid and should be reanalyzed.
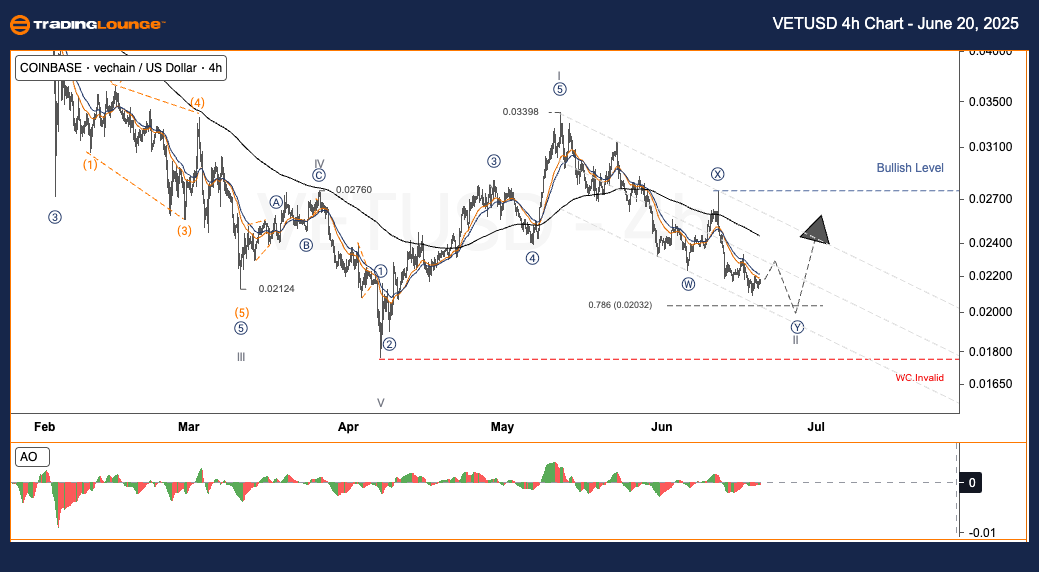
Elliott Wave Analysis - TradingLounge H4 Chart, Vechain / U.S. Dollar (VETUSD)
VETUSD Elliott Wave Technical Analysis
- Function: Counter trend
- Mode: Corrective
- Structure: Double Corrective
- Position: Wave Y
- Next Direction Higher Degree: Pending
- Wave Cancel Invalid Level: Under Review

Vechain / U.S. Dollar (VETUSD) - Trading Strategy:
VET/USD remains in the late phase of the corrective Wave II. A drop near 0.020 – 0.018 followed by a strong reversal may signal the start of Wave III and a bullish shift in momentum.
Trading Strategies:
- General Approach
-
- Short-Term Traders (Swing Trading)
-
- ✅ Look for RSI/MACD divergence and ensure no new significant lows occur.
- ✅ A strong bullish reversal candle with volume could indicate a buying opportunity.
- Risk Management
-
- 🟥 If the price declines below 0.01700, the current wave analysis becomes invalid and must be revised.
Analyst: Kittiampon Somboonsod, CEWA
Source: TradingLounge.com
More By This Author:
Elliott Wave Technical Forecast: Newmont Corporation - Thursday, June 19
Elliott Wave Technical Analysis: IBEX 35 - Thursday, June 19
Elliott Wave Technical Analysis: Euro/U.S. Dollar - Thursday, June 19
At TradingLounge™, we provide actionable Elliott Wave analysis across over 200 markets. Access live chat rooms, advanced AI & algorithmic charting tools, and curated trade ...
more


