
EURUSD Elliott Wave Analysis – Trading Lounge
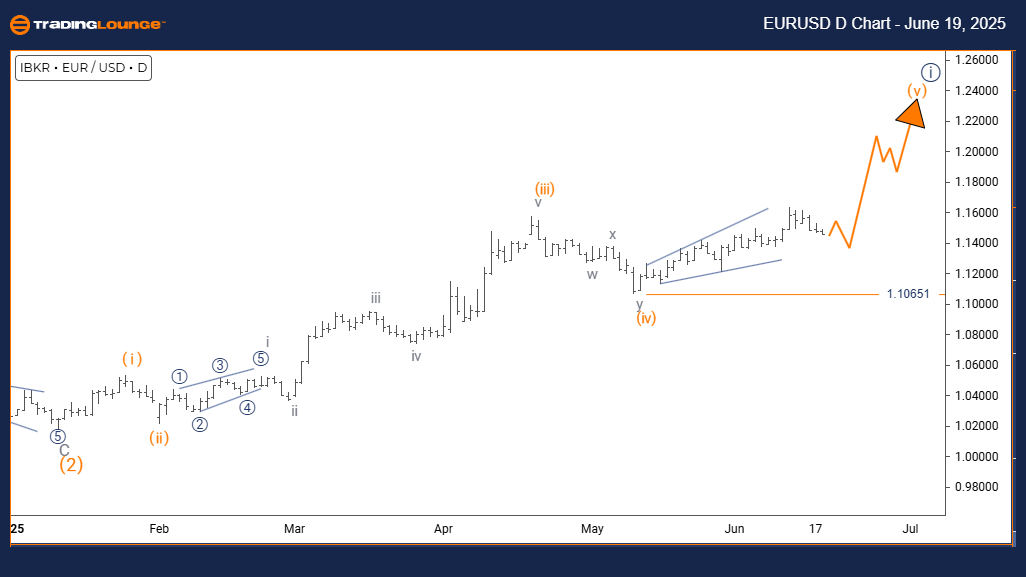
Euro/ U.S. Dollar (EURUSD) Day Chart
EURUSD Elliott Wave Technical Analysis
FUNCTION: Bullish Trend
MODE: Impulsive
STRUCTURE: Orange Wave 5
POSITION: Navy Blue Wave 1
DIRECTION NEXT HIGHER DEGREES: Orange Wave 5 (in progress)
DETAILS: Orange Wave 4 appears completed; Orange Wave 5 is now active.
Wave Cancel Invalidation Level: 1.10651
The EURUSD daily Elliott Wave analysis points to a bullish trend. Price action shows strong upward momentum, currently forming Orange Wave 5. This wave is part of a broader Navy Blue Wave 1, indicating that the pair is entering the later stages of an impulse move in a larger uptrend.
With Orange Wave 4 likely completed, the transition into Orange Wave 5 reflects the typical final leg of an Elliott Wave impulse sequence. This stage often brings powerful directional movement. Traders should focus on Orange Wave 5 development within the broader structure of Navy Blue Wave 1.
A key level to observe is the invalidation point at 1.10651. If the price drops below this, it would invalidate the current wave structure and require a new analysis. Until then, the bullish pattern supports further upward movement.
This technical setup positions EURUSD for a possible final push higher, as Orange Wave 5 follows the end of Orange Wave 4. The impulsive wave suggests ongoing buying pressure. Still, traders should be cautious of reversal signals, as this wave could mark the end of a short-term trend.
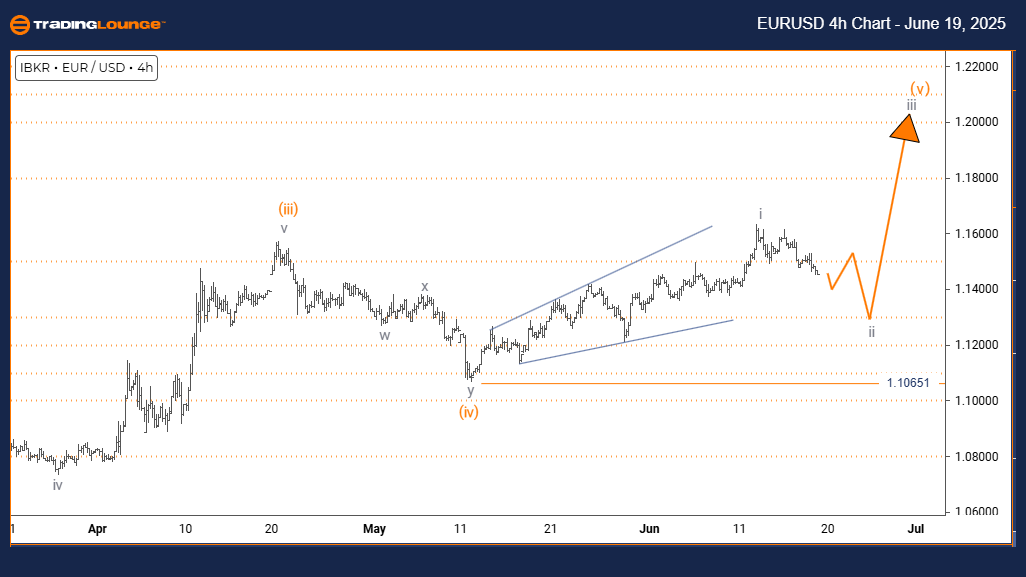
Euro/ U.S. Dollar (EURUSD) 4-Hour Chart
EURUSD Elliott Wave Technical Analysis
FUNCTION: Counter Trend
MODE: Corrective
STRUCTURE: Gray Wave 2
POSITION: Orange Wave 3
DIRECTION NEXT HIGHER DEGREES: Gray Wave 3
DETAILS: Gray Wave 1 appears completed; Gray Wave 2 is active.
Wave Cancel Invalidation Level: 1.10651
The 4-hour chart Elliott Wave analysis for EURUSD reflects a counter-trend setup. Current price action is corrective, forming Gray Wave 2, which sits within a broader Orange Wave 3. This positioning signals a temporary pullback inside an ongoing uptrend.
Gray Wave 1 seems to have completed, transitioning into Gray Wave 2. This phase typically retraces part of the previous wave’s movement. The next phase to monitor is Gray Wave 3, which could resume the dominant trend once Gray Wave 2 concludes.
Technically, EURUSD is navigating through this corrective zone. Range-bound behavior or small declines are expected until continuation. The wave cancel level at 1.10651 is crucial; falling below it would invalidate the current pattern and necessitate a new interpretation.
Traders should track Gray Wave 2 for signs of completion. Once it ends, Gray Wave 3 could initiate a stronger move in the trend direction. The current setup supports short-term consolidation before the market trends again.
Technical Analyst: Malik Awais
More By This Author:
Elliott Wave Technical Analysis: Ripple Crypto Price News For Thursday, June 19
Elliott Wave Trading SP500, Nasdaq 100, DAX 40, FTSE 100 & ASX 200
Unlocking ASX Trading Success: Cochlear Limited - Wednesday, June 18


Comments
Log in or sign up to join the conversation.