

The economic data released over the last month for China has not been great. Industrial Production for October fell to 5% YoY from 6.3% YoY in September. October Retail Sales was -0.5% YoY vs 2.5% the previous month. And both the NBS General PMI and the Caixin Composite PMI for November were below the expansion/contraction level of 50, at 47.1 and 47, respectively.
So why did the China A50 rally 14% in November and why is it continuing to move higher in December? The primary reason is the anticipation of a return to normalcy in China. The Zero-Covid policy put in place by the President of China, Xi Jinping, was established near the beginning of the Covid pandemic in order to prevent the virus from spreading. When a new case of Covid was confirmed, a whole city or region was placed under lockdown or under mandatory restrictions. However, Shanghai reopened, and hopes followed that Beijing, Zhengzhou, and Guangdong, would soon follow. Despite a rough end of November as cases increased, it was determined that the Omicron variants were not as fatal as previous versions of Covid and reopenings are occurring. In addition, China stepped in during mid-November to help support the ailing housing market which also helped to prop up the markets.
On a weekly timeframe, the China A50 had been moving higher in a wide, orderly channel since late 2015. During the week of November 23rd, 2020, the index broke above the channel near 16620 and traded aggressively higher to an all-time high of 20603.1 on February 2021. The China A50 then began pulling back in a steep downward sloping channel. The index pierced through the March 2020 lows in late October, near 11495.7, however bounced aggressively to current levels near 13064.
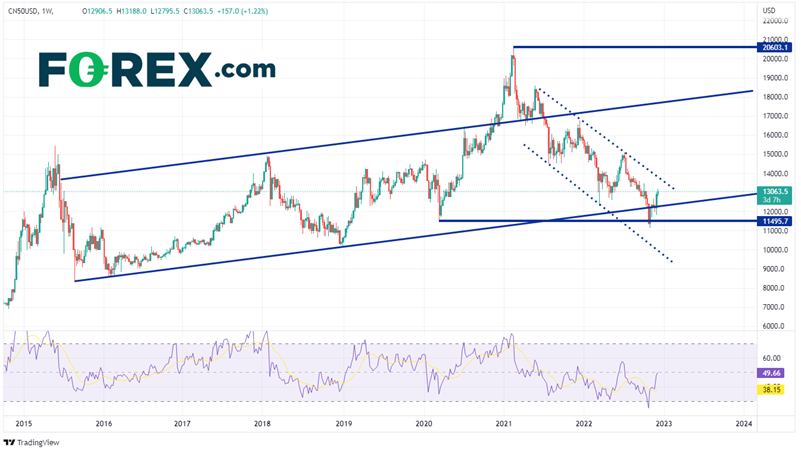
Source: Tradingivew, Stone X
On a daily timeframe, price moved lower in the dotted-lined channel across the solid blue upward sloping channel on the weekly timeframe. The solid red line is the low from March 2020. The China A50 has been moving aggressively higher since November 1st. If prices continue to move higher, the first level of resistance is at the intersection of the top, downward sloping dotted line from the channel and the 38.2% Fibonacci retracement level from the highs of May 27th, 2021 to the lows of October 31st, 2022, near 13915.3. Above there, the China A50 can move to the 50% retracement level from the same timeframe at 14773.3, then the highs from July 5th at 15078.6. However, if price moves lower, first support is at the spike lows from November 28th at 11811.5, then the lows of October 31st at 11138. If the China A50 falls below there, it can move to the bottom trendline of the downward sloping channel near 10000.
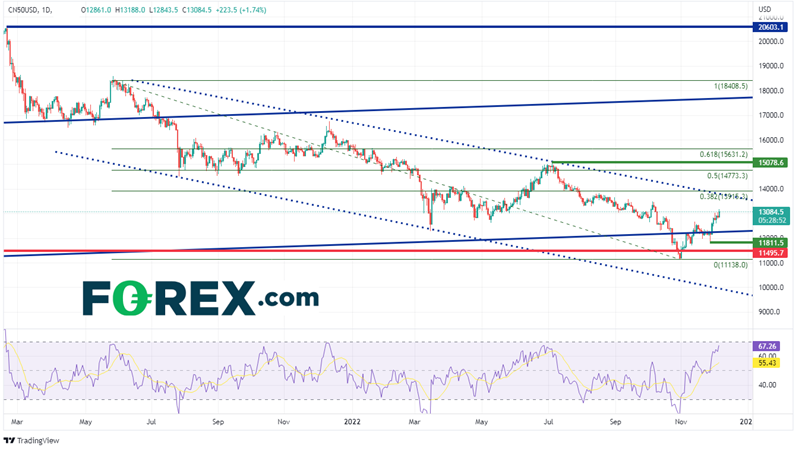
Source: Tradingivew, Stone X
If China continues to re-open its economy, slowly but surely, then the China A50 may continue to move higher as the economy begins to expand once again. However, if the re-opening leads to an increase in the spread of Covid, restrictions and possible lockdowns may have to be put back in place. This could cause the index to move lower. Watch the trendlines of the downward sloping channel to get a better idea of where price may be headed next!
More By This Author:
Currency Pair Of The Week: AUD/CAD
Week Ahead: OPEC+, RBA, BOC, And China CPI
Non-Farm Payrolls Stronger Than Expected. Does That Change The Fed’s Plan?


Comments
Log in or sign up to join the conversation.