

A month ago, expectations were for an October Non-Farm Payrolls print of 200,000. The actual October print was 261,000. November’s print was expected once again to be 200,000. The actual number of Non-Farm Payroll jobs added to the economy was 263,000! In addition, the October print was revised higher to 284,000. However, the biggest economic data point from today’s release may have been Average Hourly Earnings. The November print was 0.6% MoM, much higher than the 0.3% MoM expected. In addition, the previous reading was revised higher to 0.5%. The YoY print moved up to 5.1% from 4.9%. When Powell spoke at the Brookings Institute earlier in the week, he said that he did not see wage growth contributing to inflation. But will that outlook change after today’s release? Powell choreographed a 50bps rate hike for the December meeting. Given the continued strong jobs market and the large increase in Average Hourly Earnings, will he change his mind?
The US Dollar seems to think that there may be a chance of an increase in rate hikes by 75bps. Immediately after the print was released, USD/JPY jumped from 134.10 to 135.98 as traders feared that wages could be creeping into inflation, and therefore, the Fed may have to change its tune at the December interest rate decision meeting.
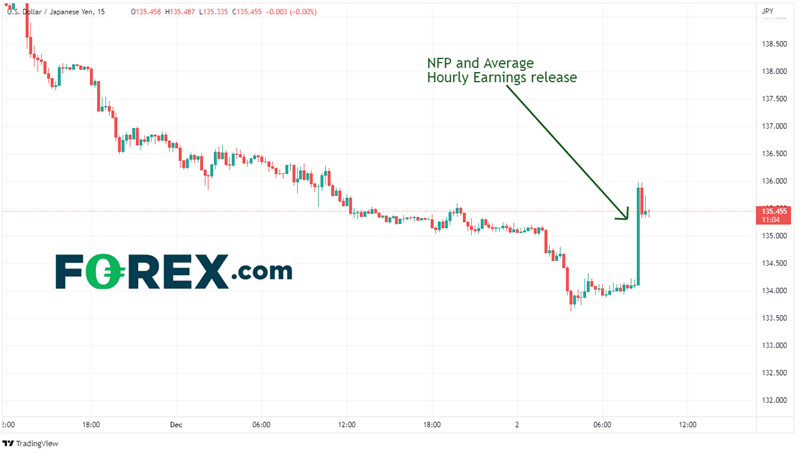
Source: Tradingview, Stone X
In addition to the NFP data results being good for the US Dollar, it also helped that USD/JPY had briefly broken below the 200 Day Moving Average at 134.50 and was running into support at the 50% retracement from the lows of March 4th to the highs of October 21st. Also notice that the RSI has moved into oversold territory, an indication that the pair may have been ready for a bounce. If today’s candlestick closes near current levels (135.30), it will be a Dragonfly Doji. When combined with an RSI in oversold territory, this can be a powerful reversal signal.

Source: Tradingview, Stone X
On a 240-minute chart, if the bounce continues and USD/JPY moves higher, the first resistance is at the intersection of a downward sloping trendline dating to November 10th and the lows from November 28th. Above there, horizontal resistance crosses at the November 30th highs of 139.89, then the highs from November 21st at 142.21. However, if the longer-term trend prevails, the first support level is at the combination of today’s low and the previously mentioned 50% retracement level between 133.30 and 133.62. Below there, support crosses at the lows of August 2nd near 130.39, then the 61.8% Fibonacci retracement from the previously mentioned timeframe at 128.90.
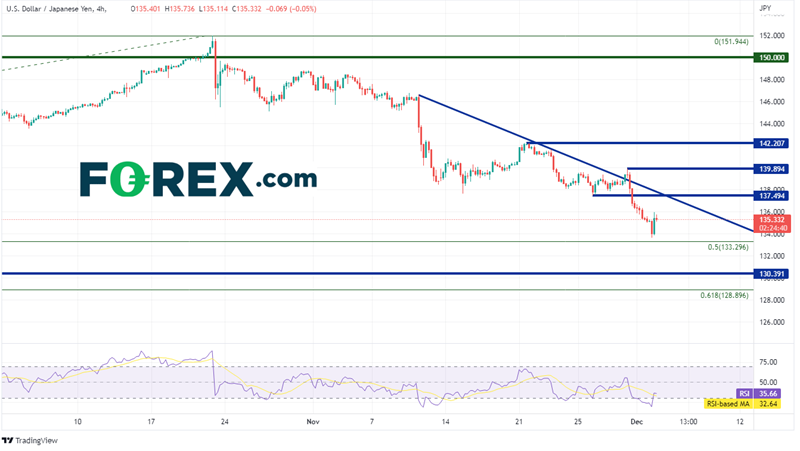
Source: Tradingview, Stone X
Will today’s Non-Farm Payroll data and Average Hourly Earnings data matter to the Fed when it meets for its interest rate decision on December 14th? The jobs report is moderate to strong, which has been good for the Fed when raising rates. However, the jobs report, together with strong Average Hourly Earnings, maybe another story. Chances are that Powell and gang stick to the plan and only hike 50bps. However, that’s not to say that they can’t increase rates later if they deem it necessary.
More By This Author:
What’s Next For The Highly Correlated Assets Of Gold And DXY?Powell's Brooking Institute Speech Is A Dovish Version Of His November 2nd FOMC Press Conference
OPEC+ Preview: Will OPEC+ Cut Production Again?


Comments
Log in or sign up to join the conversation.