
Icelandic Stock Indexes Under Pressure

Image Source: Pexels
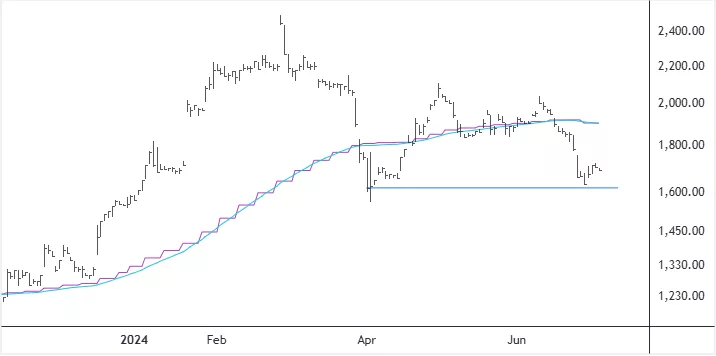
I have been watching if the two key equity market indexes in Iceland, the OMXIPI and the OMXI15, were slowly reversing their long-term trends to the upside. Unfortunately, the price action in recent weeks has not been in favor of such a thesis.
As shown in the charts below, the indexes are currently down 14.9% and 14.4% from their peaks at the end of January of this year, and my automatic, curved trendlines have rolled over from up to down.
Therefore, I expect further drops in the indexes with the next potential support levels coming in at 1966-1961 for the OMXIPI and about 2215 for the OMXI15. I will re-evaluate my view if they manage to rise above their June 12th swing highs.
OMXIPI – Daily Chart

OMXI15 – Daily Chart

My Sentiment Swing Indicator (SSI) has not reached the zero line. The end of July index value of the OMXIPI needs to stay above 1989 - otherwise, the SSI will turn downward. See the indicator here: Stocks Underperforming Bonds In Iceland | TalkMarkets.
Alvotech and Marel are the largest companies in the Icelandic stock market in terms of market capitalization. As a result, their stock prices weigh heavily on the performance of the OMXIPI and OMXI15.
Alvotech´s stock price has been forming lower peaks and must stay above 1618 to hinder more selling pressure. The price of Marel´s stock has been consolidating (moving sideways) with recent swing lows finding floor or support at the rising moving average lines. Need to see if that pattern holds in the next few days.
Share Price of Alvotech – Daily Chart
Share Price of Marel – Daily Chart

My final chart displays the rolling one-year, real total return of the OMX Iceland All-Share Index. For 25 consecutive months, or since June 2022, the real rate of return has been negative. Its current standing, using June numbers, is -2.97%, down from the -1.5% reading in May and more than 12 percentage points below the rate´s 13+ year average.
OMXI All-Share Index Real Total Return – Monthly Chart

More By This Author:
Stocks Underperforming Bonds In Iceland
S&P 500 Equal Weight Index Lagging Its Market-Cap Version
Real Total Return Of OMXI All-Share Index Still Negative
Disclosure: The author of the analysis presented does not own shares or have a position or other direct or indirect monetary interests in the financial instrument or product discussed in his articles ...
more

