

Image Source: Pixabay
The Commodities Futures Trading Commission (CFTC) has released the latest Commitment of Traders (COT) data, which provides an updated view of how large traders, such as speculators and commercial entities, positioned themselves in the futures markets. This data is current as of Tuesday, March 28.
Weekly Speculator Changes Led by Silver & Platinum
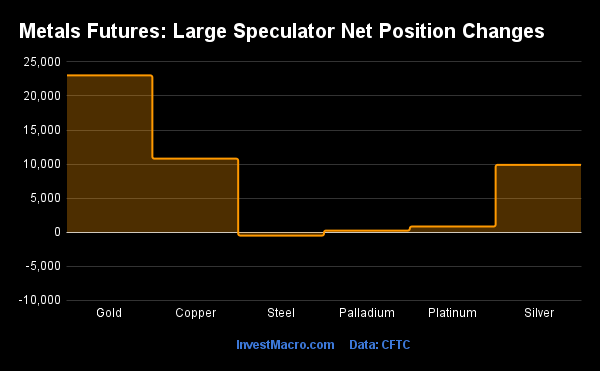
The COT metals markets speculator bets were higher this week, as five out of the six metals markets we cover had higher positioning while the other markets had lower speculator contracts.
Leading the gains for the metals was gold (23,025 contracts), with copper (10,806 contracts), silver (9,899 contracts), platinum (848 contracts), and palladium (254 contracts) also experiencing a positive week. The only market with declines in speculator bets for the week was steel (-484 contracts).
Gold Speculator Bets Continue to Climb to 44-Week High
Highlighting the COT metals data this week was the continued bullishness for gold speculative positions. The large speculator position in gold futures climbed this week for a third straight week, and for the fifth time out of the past six weeks. Gold speculator bets have now advanced by a total of +83,156 contracts over just the past three weeks.
The position in gold has increased from a total net position of +105,529 contracts on Feb. 14 to a total of +181,630 contracts this week, which marks the highest level in 44-weeks, dating back to May of 2022. The boost in speculator sentiment has pushed the gold speculator strength score to 57.0% (0 to 100% over a three-year range), while the six-week speculator strength score trend has gained by 33.5%.
The gold futures price saw a small gain this week after a small decline last week. Previously, gold futures had risen for three straight weeks and hit the highest price in just about a year over the $2,014.00 level. This week, gold futures managed to reach a high back over the $2,000.00 price level, but then retreated to close at $1,986.20.
Data Snapshot of Commodity Market Traders | Columns Legend
|
Mar-28-2023
|
OI
|
OI-Index
|
Spec-Net
|
Spec-Index
|
Com-Net
|
COM-Index
|
Smalls-Net
|
Smalls-Index
|
|---|---|---|---|---|---|---|---|---|
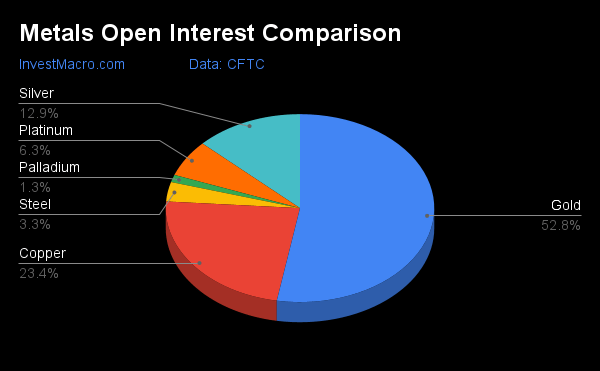
| Gold | 478,611 | 26 | 181,630 | 57 | -201,508 | 46 | 19,878 | 30 |
| Copper | 211,889 | 52 | -1,545 | 27 | -4,924 | 69 | 6,469 | 59 |
| Silver | 117,395 | 0 | 13,361 | 37 | -21,875 | 67 | 8,514 | 14 |
| Platinum | 57,244 | 32 | 10,374 | 40 | -14,781 | 63 | 4,407 | 27 |
| Palladium | 11,514 | 78 | -6,764 | 3 | 7,193 | 98 | -429 | 16 |
Strength Scores Led by Steel & Gold
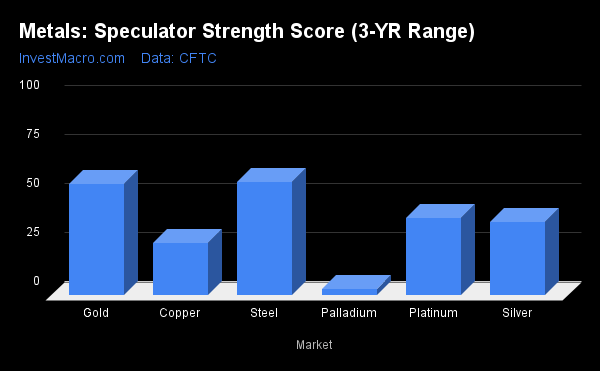
COT strength scores (which are a normalized measure of speculator positions over a three-year range from 0 to 100, where above 80 is Extreme-Bullish and below 20 is Extreme-Bearish) showed that steel (58%) and gold (57%) led the metals markets this week. Platinum (39.5%) came in as the next highest in terms of the weekly strength scores.
On the downside, palladium (3.1%) came in at the lowest strength level and is in Extreme-Bearish territory (below 20%).
Strength statistics:
- Gold (57.0%) vs. gold the previous week (46.9%).
- Silver (37.3%) vs. silver the previous week (23.2%).
- Copper (27.0%) vs. copper the previous week (17.4%).
- Platinum (39.5%) vs. platinum the previous week (37.6%).
- Palladium (3.1%) vs. palladium the previous week (0.7%).
- Steel (57.9%) vs. palladium the previous week (59.3%).
Gold & Platinum Top the Six-Week Strength Trends
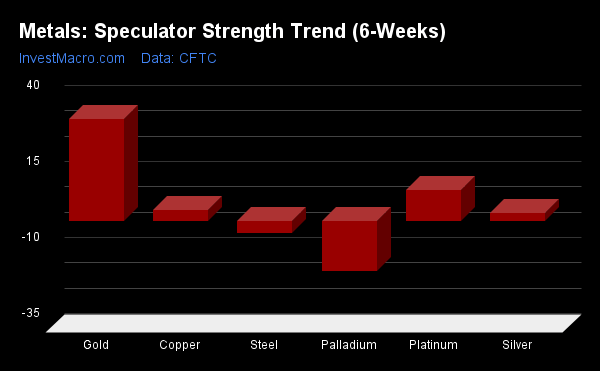
COT strength score trends (or otherwise called the move index, which calculates the six-week changes in strength scores) showed that gold (34%) and platinum (10%) led the trends for metals for the past six weeks. Palladium (-16%) was the leader to the downside in terms of trend scores, with steel (-4%) following behind with the next lowest trend scores.
Move statistics:
- Gold (33.5%) vs. gold the previous week (13.1%).
- Silver (2.6%) vs. silver the previous week (-14.4%).
- Copper (3.5%) vs. copper the previous week (-13.3%).
- Platinum (10.1%) vs. platinum the previous week (-2.5%).
- Palladium (-16.4%) vs. palladium the previous week (-26.9%).
- Steel (-3.8%) vs. steel the previous week (-1.3%).
Individual Markets - Gold Comex Futures
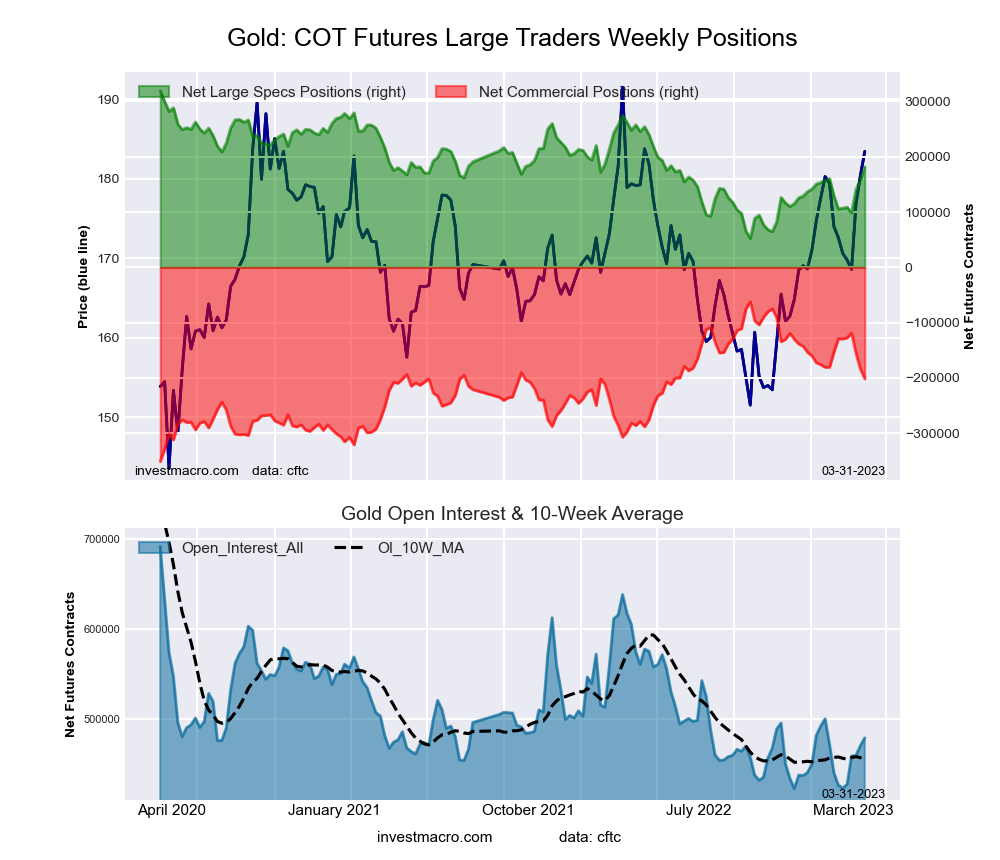
The gold Comex futures large speculator standing this week came in at a net position of 181,630 contracts in the data reported through Tuesday. This was a weekly rise of 23,025 contracts from the previous week, which had a total of 158,605 net contracts.
This week’s current strength score (the trader positioning range over the past three years, measured from 0 to 100) shows the speculators are currently Bullish with a score of 57.0%. The commercials are Bearish with a score of 46.1%, and the small traders (not shown in the chart) are Bearish with a score of 29.8%.
| Gold Futures Statistics | SPECULATORS | COMMERCIALS | SMALL TRADERS |
| –% of Open Interest Longs: | 51.2 | 27.5 | 9.9 |
| –% of Open Interest Shorts: | 13.3 | 69.6 | 5.7 |
| – Net Position: | 181,630 | -201,508 | 19,878 |
| – Gross Longs: | 245,135 | 131,786 | 47,388 |
| – Gross Shorts: | 63,505 | 333,294 | 27,510 |
| – Long to Short Ratio: | 3.9 to 1 | 0.4 to 1 | 1.7 to 1 |
| NET POSITION TREND: | |||
| – Strength Index Score (3 Year Range Pct): | 57.0 | 46.1 | 29.8 |
| – Strength Index Reading (3 Year Range): | Bullish | Bearish | Bearish |
| NET POSITION MOVEMENT INDEX: | |||
| – 6-Week Change in Strength Index: | 33.5 | -28.0 | -9.2 |
Silver Comex Futures
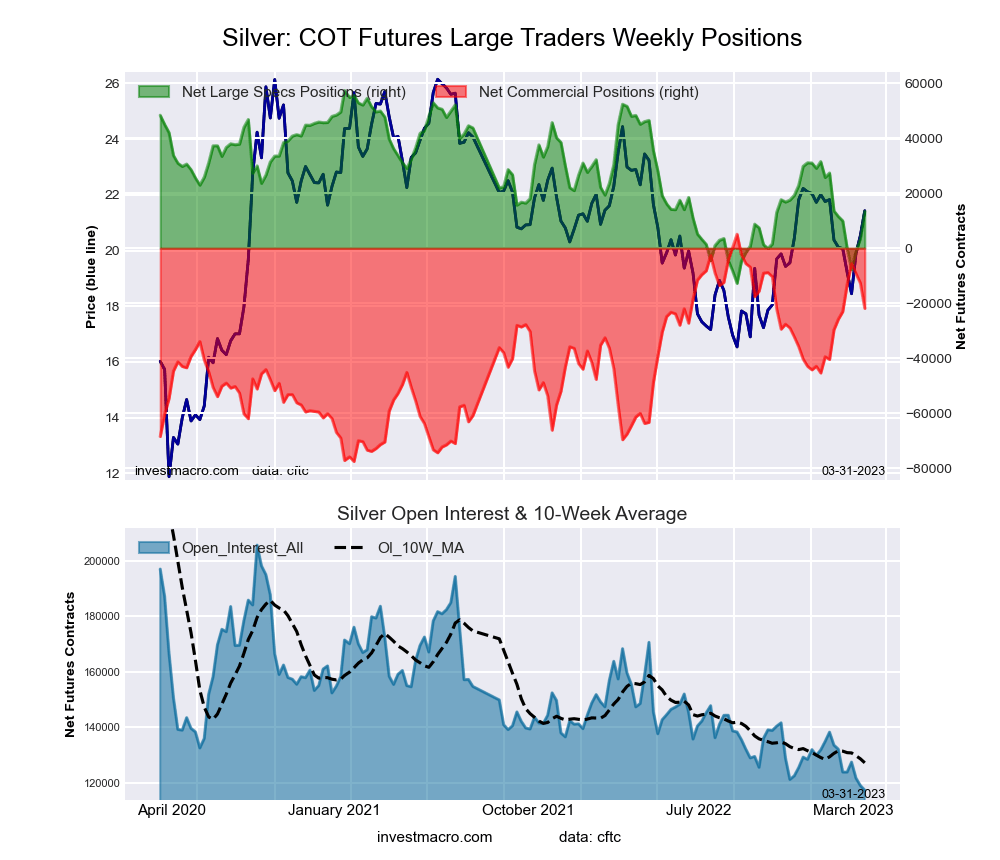
The silver Comex futures large speculator standing this week came in at a net position of 13,361 contracts in the data reported through Tuesday. This was a weekly lift of 9,899 contracts from the previous week, which had a total of 3,462 net contracts.
This week’s current strength score shows the speculators are currently Bearish with a score of 37.3%. The commercials are Bullish with a score of 67.4%, and the small traders are Bearish-Extreme with a score of 13.5%.
| Silver Futures Statistics | SPECULATORS | COMMERCIALS | SMALL TRADERS |
| –% of Open Interest Longs: | 36.0 | 38.3 | 18.8 |
| –% of Open Interest Shorts: | 24.6 | 56.9 | 11.5 |
| – Net Position: | 13,361 | -21,875 | 8,514 |
| – Gross Longs: | 42,254 | 44,970 | 22,062 |
| – Gross Shorts: | 28,893 | 66,845 | 13,548 |
| – Long to Short Ratio: | 1.5 to 1 | 0.7 to 1 | 1.6 to 1 |
| NET POSITION TREND: | |||
| – Strength Index Score (3 Year Range Pct): | 37.3 | 67.4 | 13.5 |
| – Strength Index Reading (3 Year Range): | Bearish | Bullish | Bearish-Extreme |
| NET POSITION MOVEMENT INDEX: | |||
| – 6-Week Change in Strength Index: | 2.6 | 4.8 | -32.5 |
Copper Grade #1 Futures
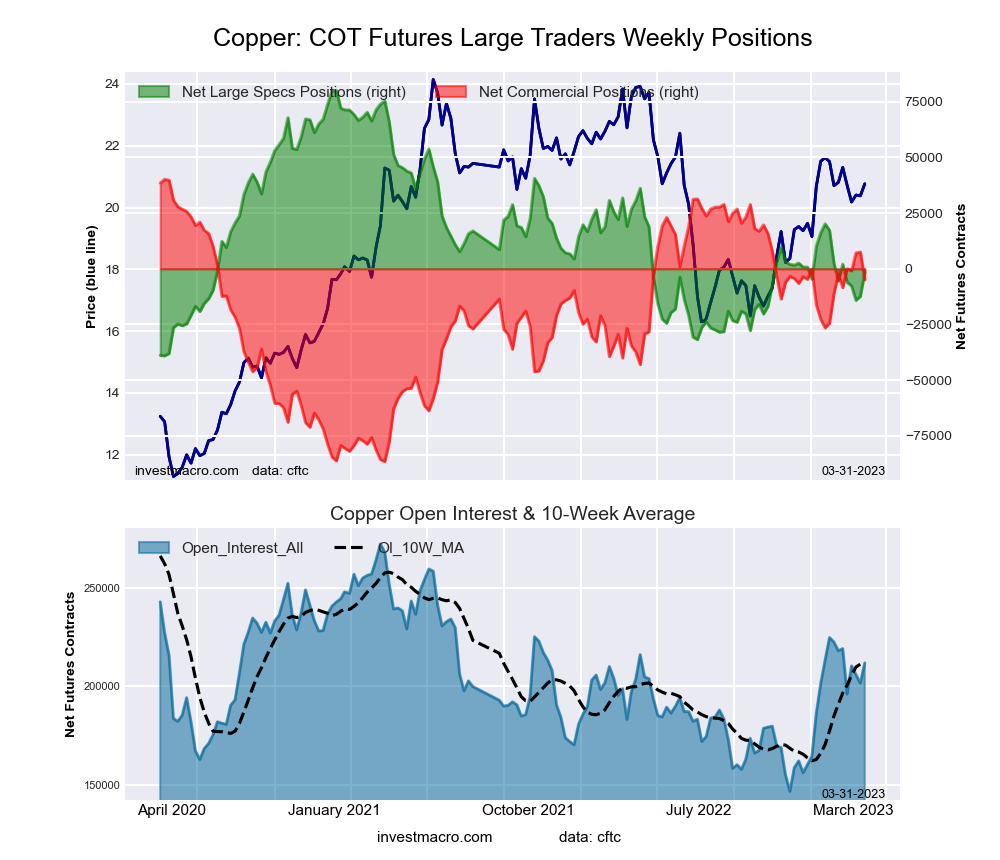
The copper Grade #1 futures large speculator standing this week came in at a net position of -1,545 contracts in the data reported through Tuesday. This was a weekly lift of 10,806 contracts from the previous week, which had a total of -12,351 net contracts.
This week’s current strength score shows the speculators are currently Bearish with a score of 27.0%. The commercials are Bullish with a score of 69.2%, and the small traders are Bullish with a score of 59.3%.
| Copper Futures Statistics | SPECULATORS | COMMERCIALS | SMALL TRADERS |
| –% of Open Interest Longs: | 26.7 | 44.3 | 8.7 |
| –% of Open Interest Shorts: | 27.4 | 46.6 | 5.7 |
| – Net Position: | -1,545 | -4,924 | 6,469 |
| – Gross Longs: | 56,595 | 93,920 | 18,451 |
| – Gross Shorts: | 58,140 | 98,844 | 11,982 |
| – Long to Short Ratio: | 1.0 to 1 | 1.0 to 1 | 1.5 to 1 |
| NET POSITION TREND: | |||
| – Strength Index Score (3 Year Range Pct): | 27.0 | 69.2 | 59.3 |
| – Strength Index Reading (3 Year Range): | Bearish | Bullish | Bullish |
| NET POSITION MOVEMENT INDEX: | |||
| – 6-Week Change in Strength Index: | 3.5 | -2.2 | -8.5 |
Platinum Futures
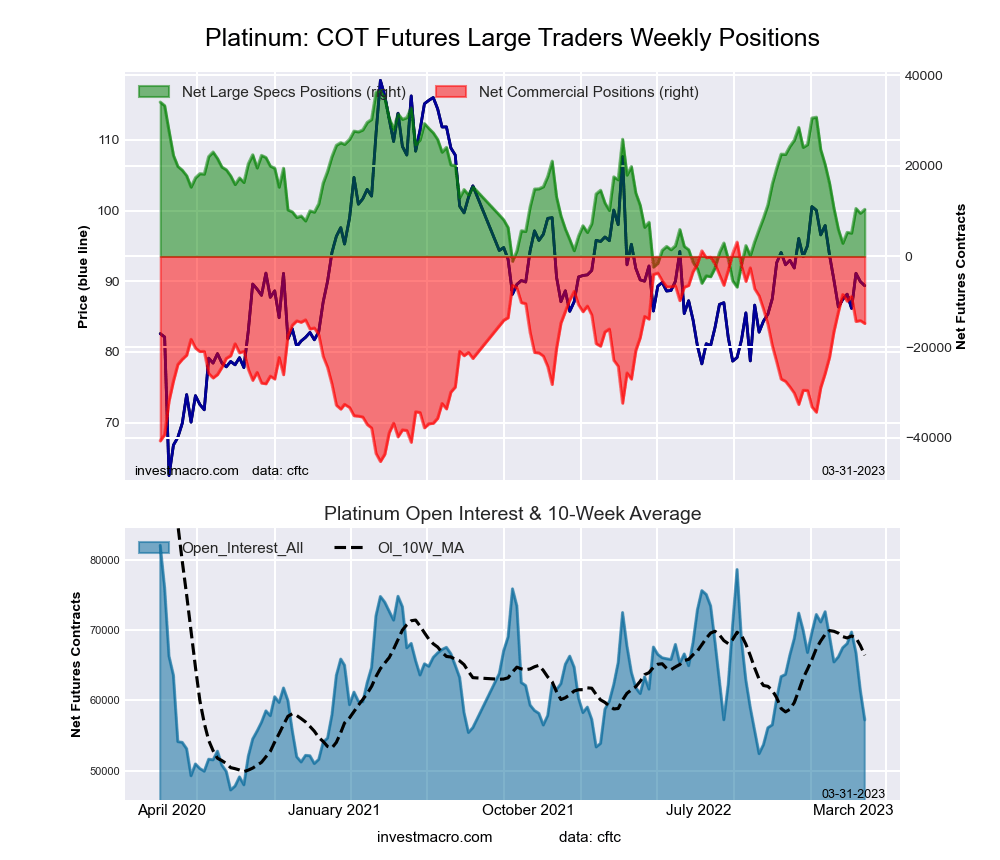
The platinum futures large speculator standing this week came in at a net position of 10,374 contracts in the data reported through Tuesday. This was a weekly gain of 848 contracts from the previous week, which had a total of 9,526 net contracts.
This week’s current strength score shows the speculators are currently Bearish with a score of 39.5%. The commercials are Bullish with a score of 62.9%, and the small traders are Bearish with a score of 27.2%.
| Platinum Futures Statistics | SPECULATORS | COMMERCIALS | SMALL TRADERS |
| –% of Open Interest Longs: | 42.4 | 40.4 | 12.6 |
| –% of Open Interest Shorts: | 24.2 | 66.3 | 4.9 |
| – Net Position: | 10,374 | -14,781 | 4,407 |
| – Gross Longs: | 24,247 | 23,146 | 7,193 |
| – Gross Shorts: | 13,873 | 37,927 | 2,786 |
| – Long to Short Ratio: | 1.7 to 1 | 0.6 to 1 | 2.6 to 1 |
| NET POSITION TREND: | |||
| – Strength Index Score (3 Year Range Pct): | 39.5 | 62.9 | 27.2 |
| – Strength Index Reading (3 Year Range): | Bearish | Bullish | Bearish |
| NET POSITION MOVEMENT INDEX: | |||
| – 6-Week Change in Strength Index: | 10.1 | -5.2 | -24.7 |
Palladium Futures
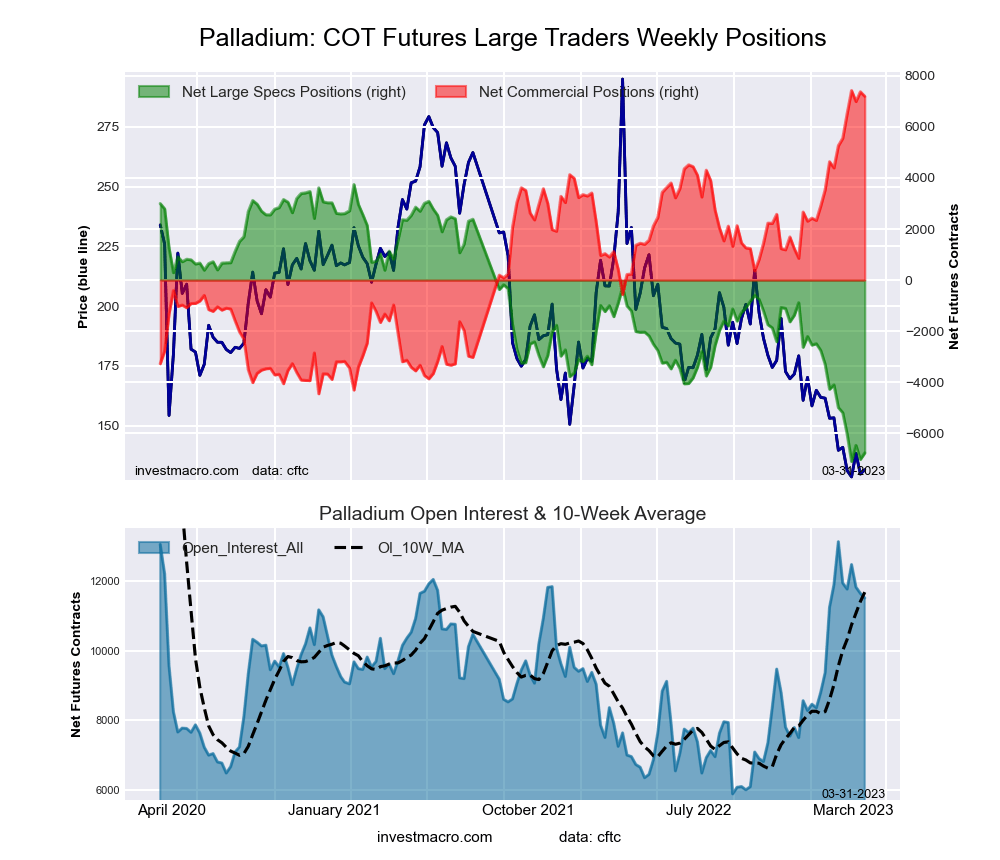
The palladium futures large speculator standing this week came in at a net position of -6,764 contracts in the data reported through Tuesday. This was a weekly gain of 254 contracts from the previous week, which had a total of -7,018 net contracts.
This week’s current strength score shows the speculators are currently Bearish-Extreme with a score of 3.1%. The commercials are Bullish-Extreme with a score of 98.1%, and the small traders are Bearish-Extreme with a score of 15.9%.
| Palladium Futures Statistics | SPECULATORS | COMMERCIALS | SMALL TRADERS |
| –% of Open Interest Longs: | 13.8 | 72.2 | 10.2 |
| –% of Open Interest Shorts: | 72.6 | 9.7 | 13.9 |
| – Net Position: | -6,764 | 7,193 | -429 |
| – Gross Longs: | 1,593 | 8,314 | 1,174 |
| – Gross Shorts: | 8,357 | 1,121 | 1,603 |
| – Long to Short Ratio: | 0.2 to 1 | 7.4 to 1 | 0.7 to 1 |
| NET POSITION TREND: | |||
| – Strength Index Score (3 Year Range Pct): | 3.1 | 98.1 | 15.9 |
| – Strength Index Reading (3 Year Range): | Bearish-Extreme | Bullish-Extreme | Bearish-Extreme |
| NET POSITION MOVEMENT INDEX: | |||
| – 6-Week Change in Strength Index: | -16.4 | 16.3 | -9.6 |
Steel Futures
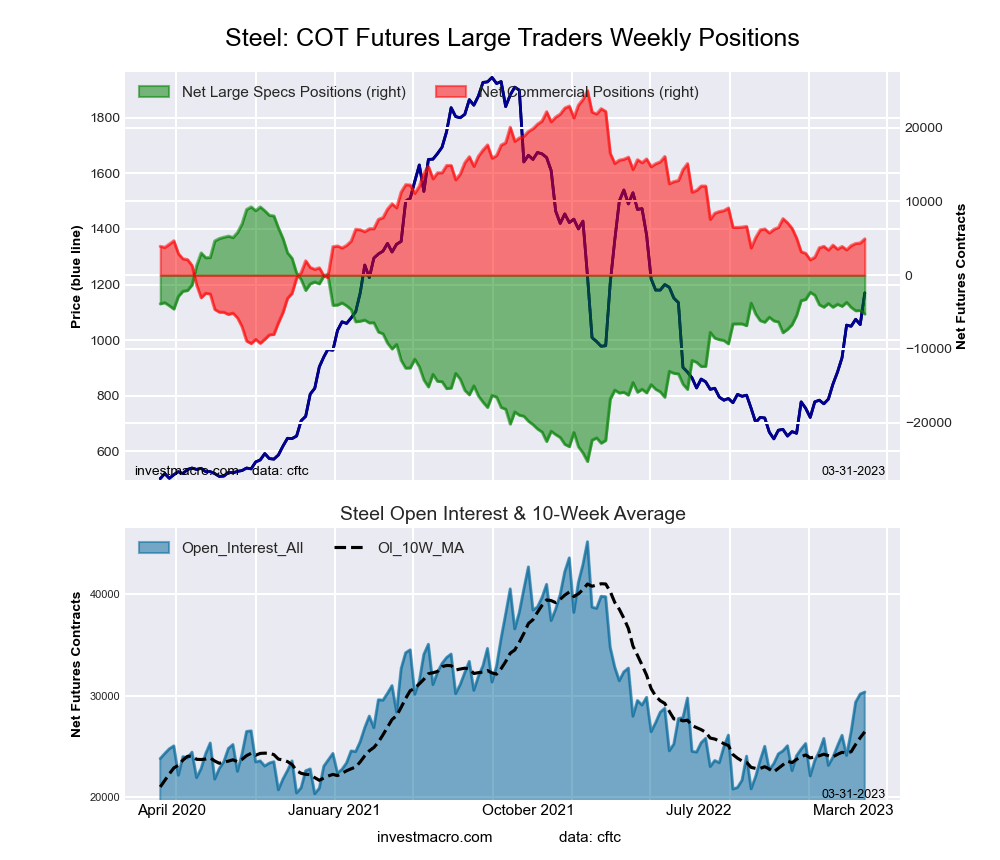
The steel futures large speculator standing this week came in at a net position of -5,255 contracts in the data reported through Tuesday. This was a weekly decline of -484 contracts from the previous week, which had a total of -4,771 net contracts.
This week’s current strength score shows the speculators are currently Bullish with a score of 57.9%. The commercials are Bearish with a score of 41.4%, and the small traders are Bullish with a score of 61.4%.
| Steel Futures Statistics | SPECULATORS | COMMERCIALS | SMALL TRADERS |
| –% of Open Interest Longs: | 12.1 | 76.1 | 1.4 |
| –% of Open Interest Shorts: | 29.5 | 59.8 | 0.3 |
| – Net Position: | -5,255 | 4,933 | 322 |
| – Gross Longs: | 3,687 | 23,103 | 422 |
| – Gross Shorts: | 8,942 | 18,170 | 100 |
| – Long to Short Ratio: | 0.4 to 1 | 1.3 to 1 | 4.2 to 1 |
| NET POSITION TREND: | |||
| – Strength Index Score (3 Year Range Pct): | 57.9 | 41.4 | 61.4 |
| – Strength Index Reading (3 Year Range): | Bullish | Bearish | Bullish |
| NET POSITION MOVEMENT INDEX: | |||
| – 6-Week Change in Strength Index: | -3.8 | 4.1 | -11.0 |
Article By InvestMacro – Receive our weekly COT Newsletter.
COT Report: The COT data, released weekly to the public each Friday, is updated through the most recent Tuesday (data is three days old), and it shows a quick view of how large speculators or non-commercials (for-profit traders) were positioned in the futures markets.
The CFTC categorizes trader positions according to commercial hedgers (traders who use futures contracts for hedging as part of the business), non-commercials (large traders who speculate to realize trading profits), and non-reportable traders (usually small traders/speculators) as well as their open interest (contracts open in the market at time of reporting). See CFTC criteria here.
More By This Author:
Large Speculators Have Dropped Their Corn Bullish Bets To Near 130-Week Lows
Currency Speculators Drop Their Canadian Dollar Bets Fall To 218-Week Low
COT Bonds Speculators Boosting 2-Year Bond Bets After Record Low


Comments
Log in or sign up to join the conversation.