
Gold – Topping Process Followed By A Pullback
While US regulators are racing to secure the sale of California bank First Republic, the US banking crisis continues and is far from being over. Gold, on the other hand, remains the currency of last resort and has no counterparty risk. It has been strongly rising over the last six months and hence sniffing out the increasing challenges in the fiat money system.

Review
Last autumn, a new chapter was opened in the gold market with a triple bottom around 1,615 USD. Since then, the price of gold has risen significantly, peaking at 2,048 USD. A more than solid increase of 26.73% within six months.
During this impressive upward movement, gold reached a temporary high in early February at 1,959 USD, followed by a pullback to 1,804 USD in early March, which we clearly identified as another buying opportunity in the gold market. As the US banking crisis escalated in March, gold quickly and dramatically recovered. Finally, on April 13th, gold reached its highest level since March 9th, 2022, at 2,048 USD.
After the strong price increases, the gold market became clearly overbought, resulting in a pullback over the last two weeks down to 1,969 USD. Since then, gold has been consolidating sideways between 1,970 and 2,010 USD. However, the bullish character has not been lost so far. Therefore, a clear trend reversal has not yet been observed.
Silver gains nearly 50% in eight months
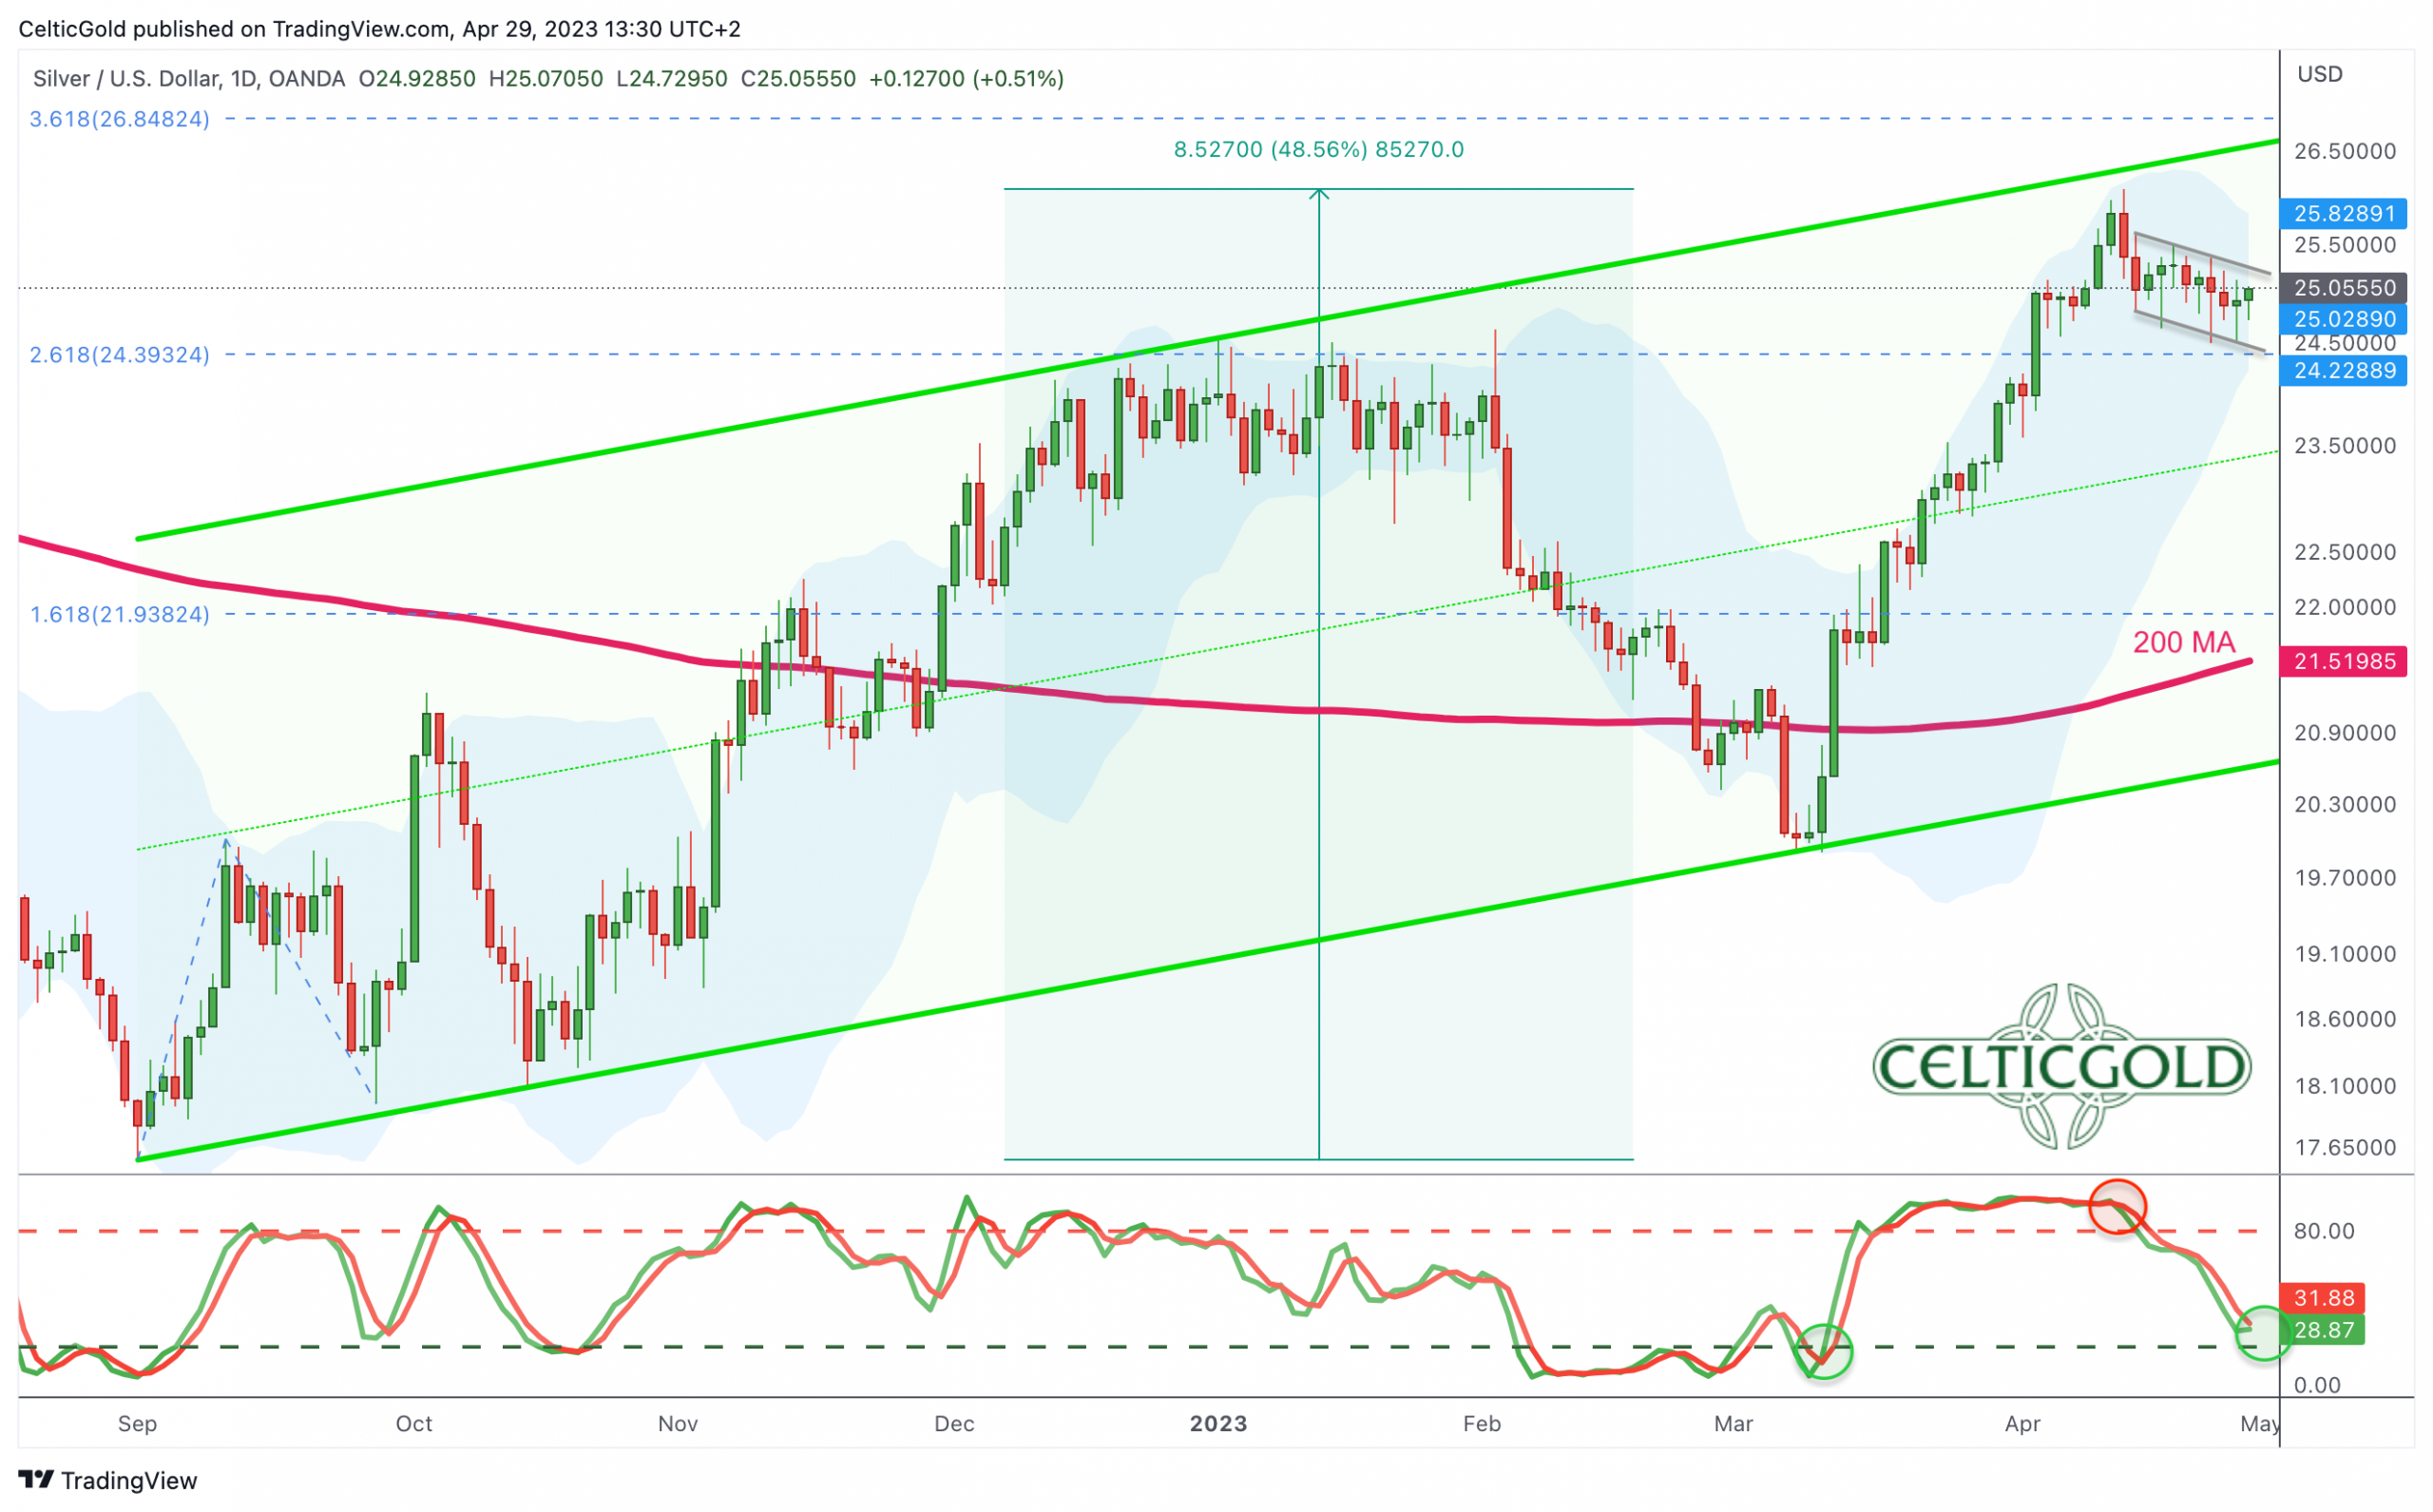
Silver in US-Dollar, weekly chart as of April 29th, 2023. Source: Tradingview.
Silver’s performance is even more impressive. Silver prices bottomed out at 17.56 USD on September 1st, 2022, around two months before gold prices started to rise. With the recent high at 26.07 USD, the silver price has increased by 48.51% in the past eight months. Despite a recent pullback down to 24.47 USD and an ongoing consolidation, a clear end to the uptrend is not yet visible. The next Fibonacci extension is waiting at 26.84 USD.
Chart Analysis – Gold in US-Dollar
Weekly chart: Overbought and with negative divergences
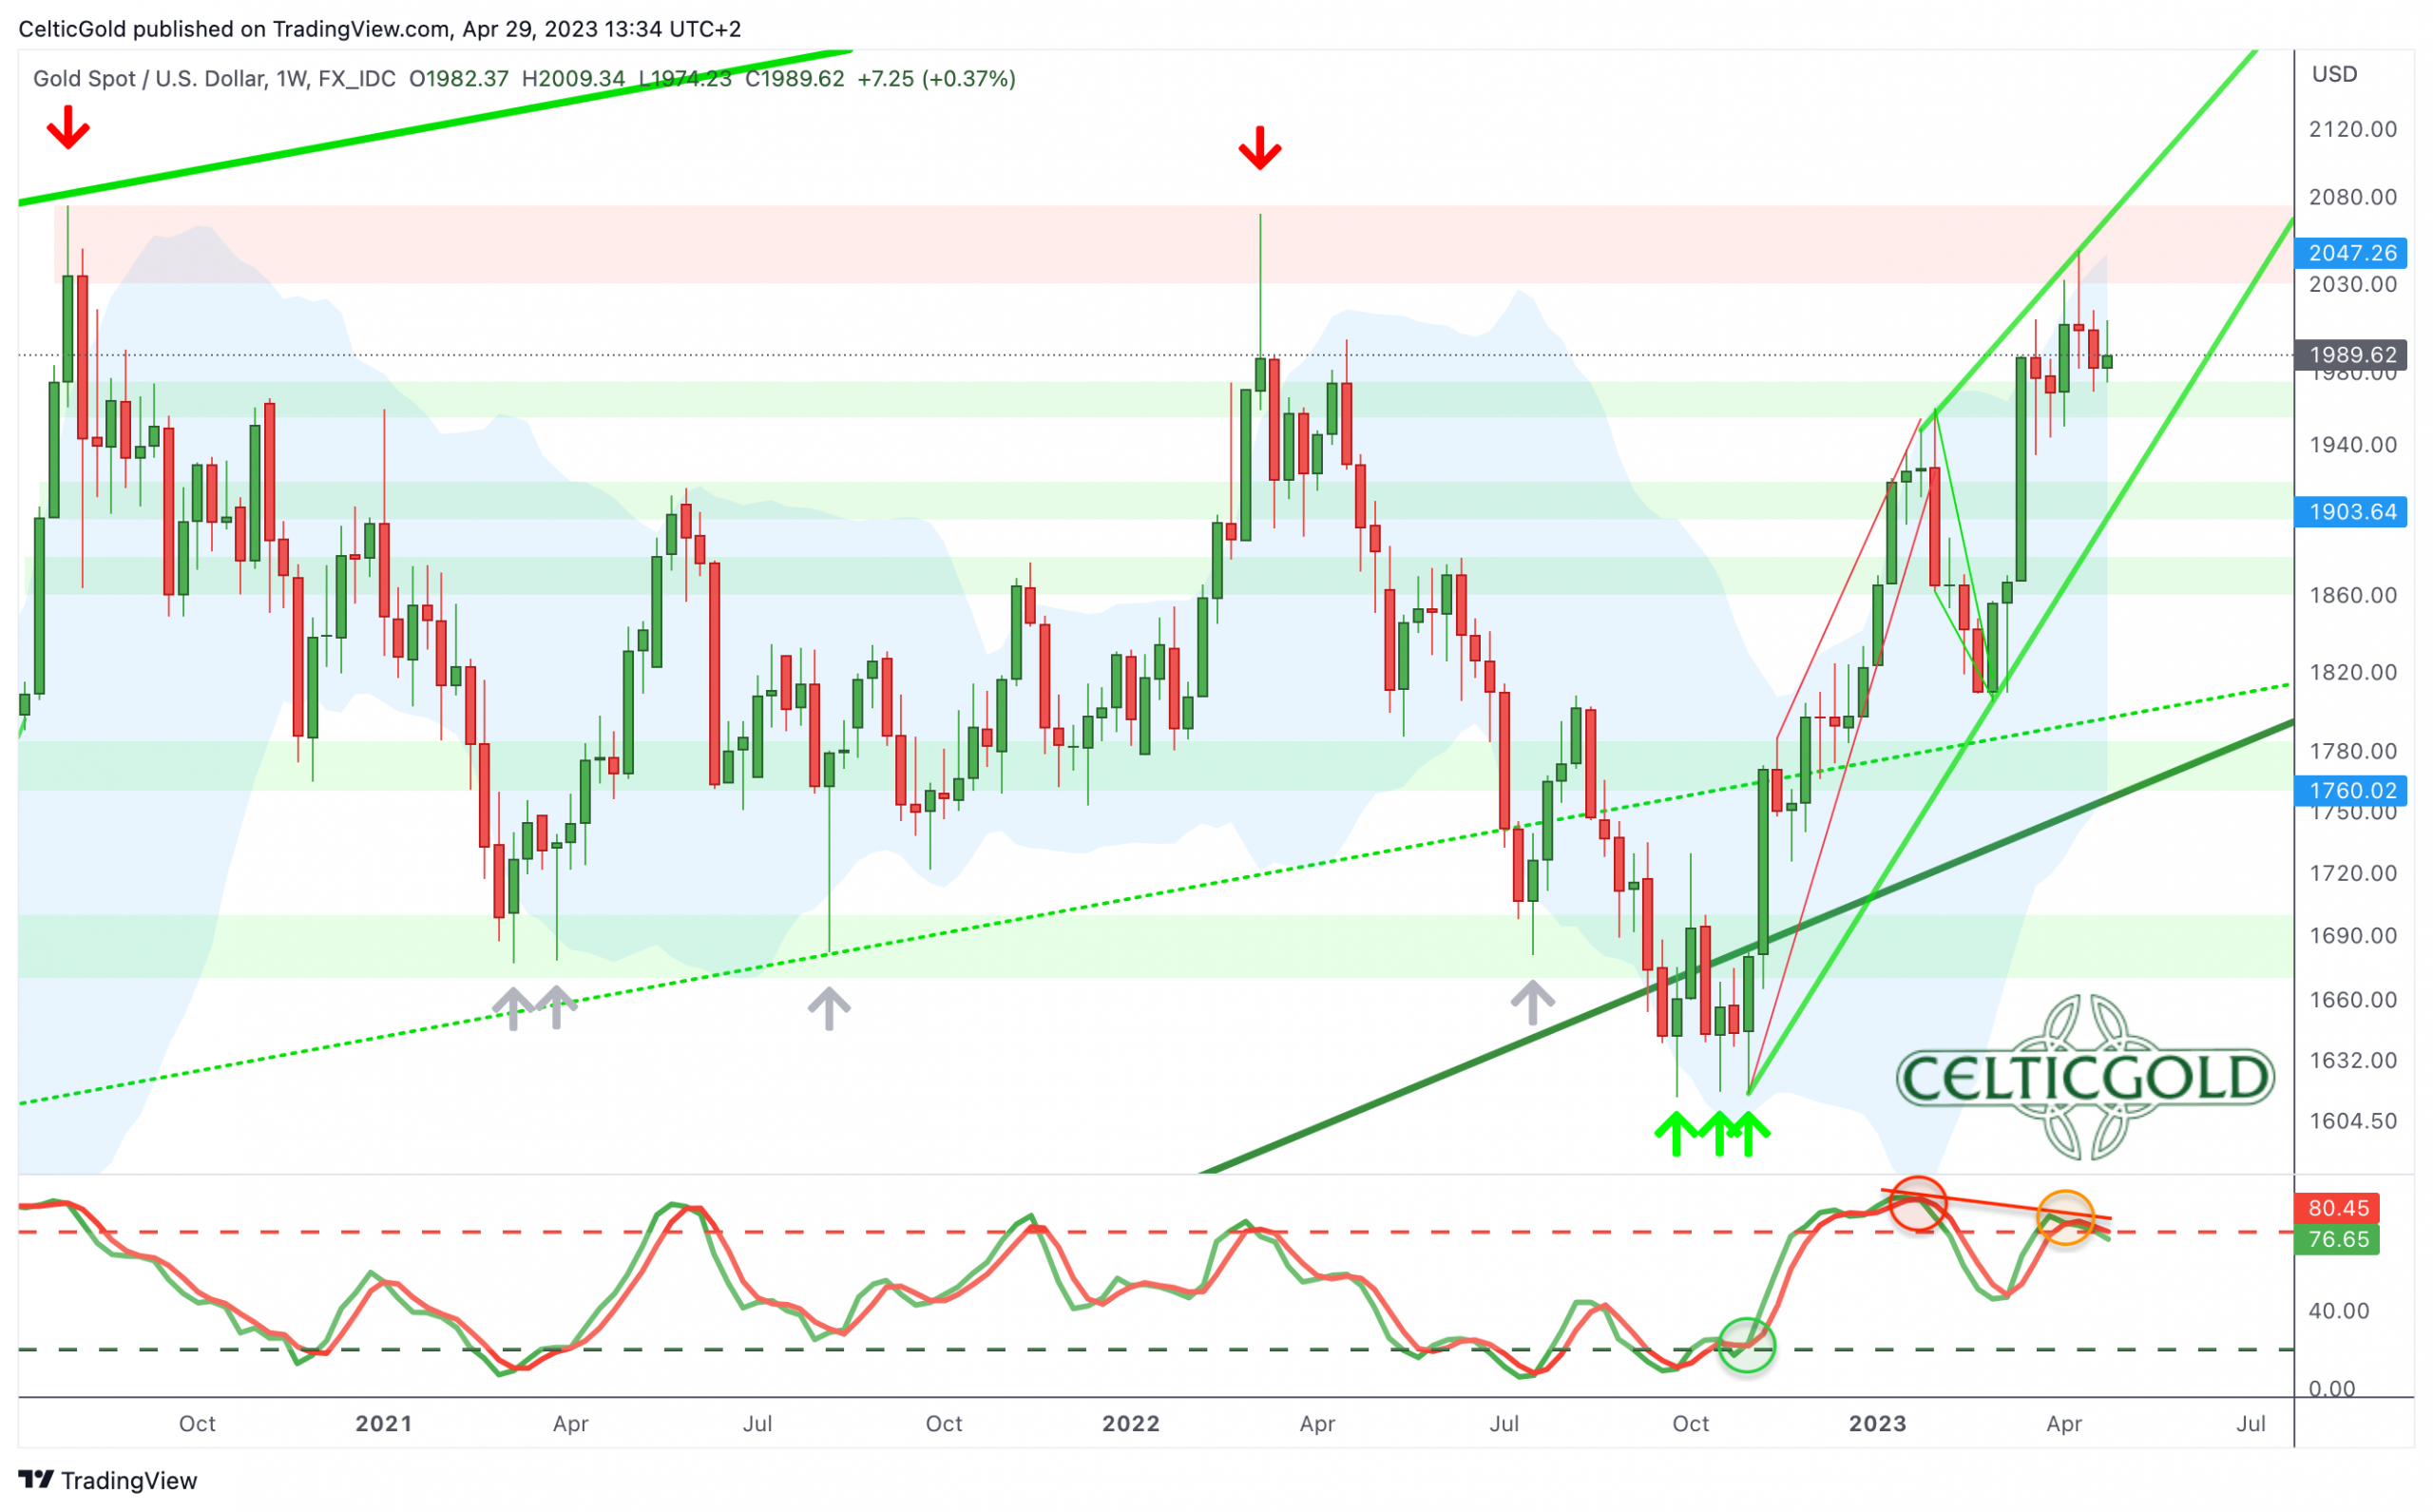
Gold in US-Dollar, weekly chart as of April 29th, 2023. Source: Tradingview.
Following gold’s sharp rally from early November until the end of January, the pullback in February provided a healthy cooling-off period and gave new impetus to the gold market. Accordingly, strong bullish momentum was seen through all of March and until mid of April.
However, over the last two weeks, momentum has been waning as prices approached the psychological level of 2,000 USD. Price gains on the upside got more and more sluggish, while volatility has increased. Overall, there has been a lot of back-and-forth, with neither bulls nor bears able to gain the upper hand.
Of course, the rally of the past six months with gains of around 430 USD has taken a lot of strength. In addition, market participants need to get used to the new price level at or above 2,000 USD. Furthermore, the well-known resistance zone between 2,030 and 2,075 USD not only attracts short-sellers but also makes profit-taking appear sensible. The increase in hedging activities among the major gold producers as well as the spreading of private placements by those highly speculative Canadian exploration companies add further headwinds and do cannibalize the gold price.
Weekly stochastic on the verge of issuing a sell signal
From a technical perspective, the indicators on the weekly chart are clearly overbought, and the negative divergences are increasing significantly. In fact, the weekly stochastic is on the verge of issuing a sell signal and has not confirmed the recent new high. With this configuration, a direct breakthrough to new all-time highs above 2,075 USD appears highly unlikely. Nevertheless, a kind of “topping process” with one or two further attempts to breach the 2,050 USD mark in the coming weeks is still possible.
Overall, the weekly chart is still bullish, but the warning signals are increasing significantly. This is certainly not the time to open new medium- to long-term long positions in the gold market. Although the upper Bollinger Band still provides room up to around 2,047 USD, the stochastic is already turning downward, indicating a larger corrective move is slowly but surely coming. Currently, a pullback would likely lead to the strong support zone between 1,900 and 1,930 USD.
Daily chart: Consolidation at a high level
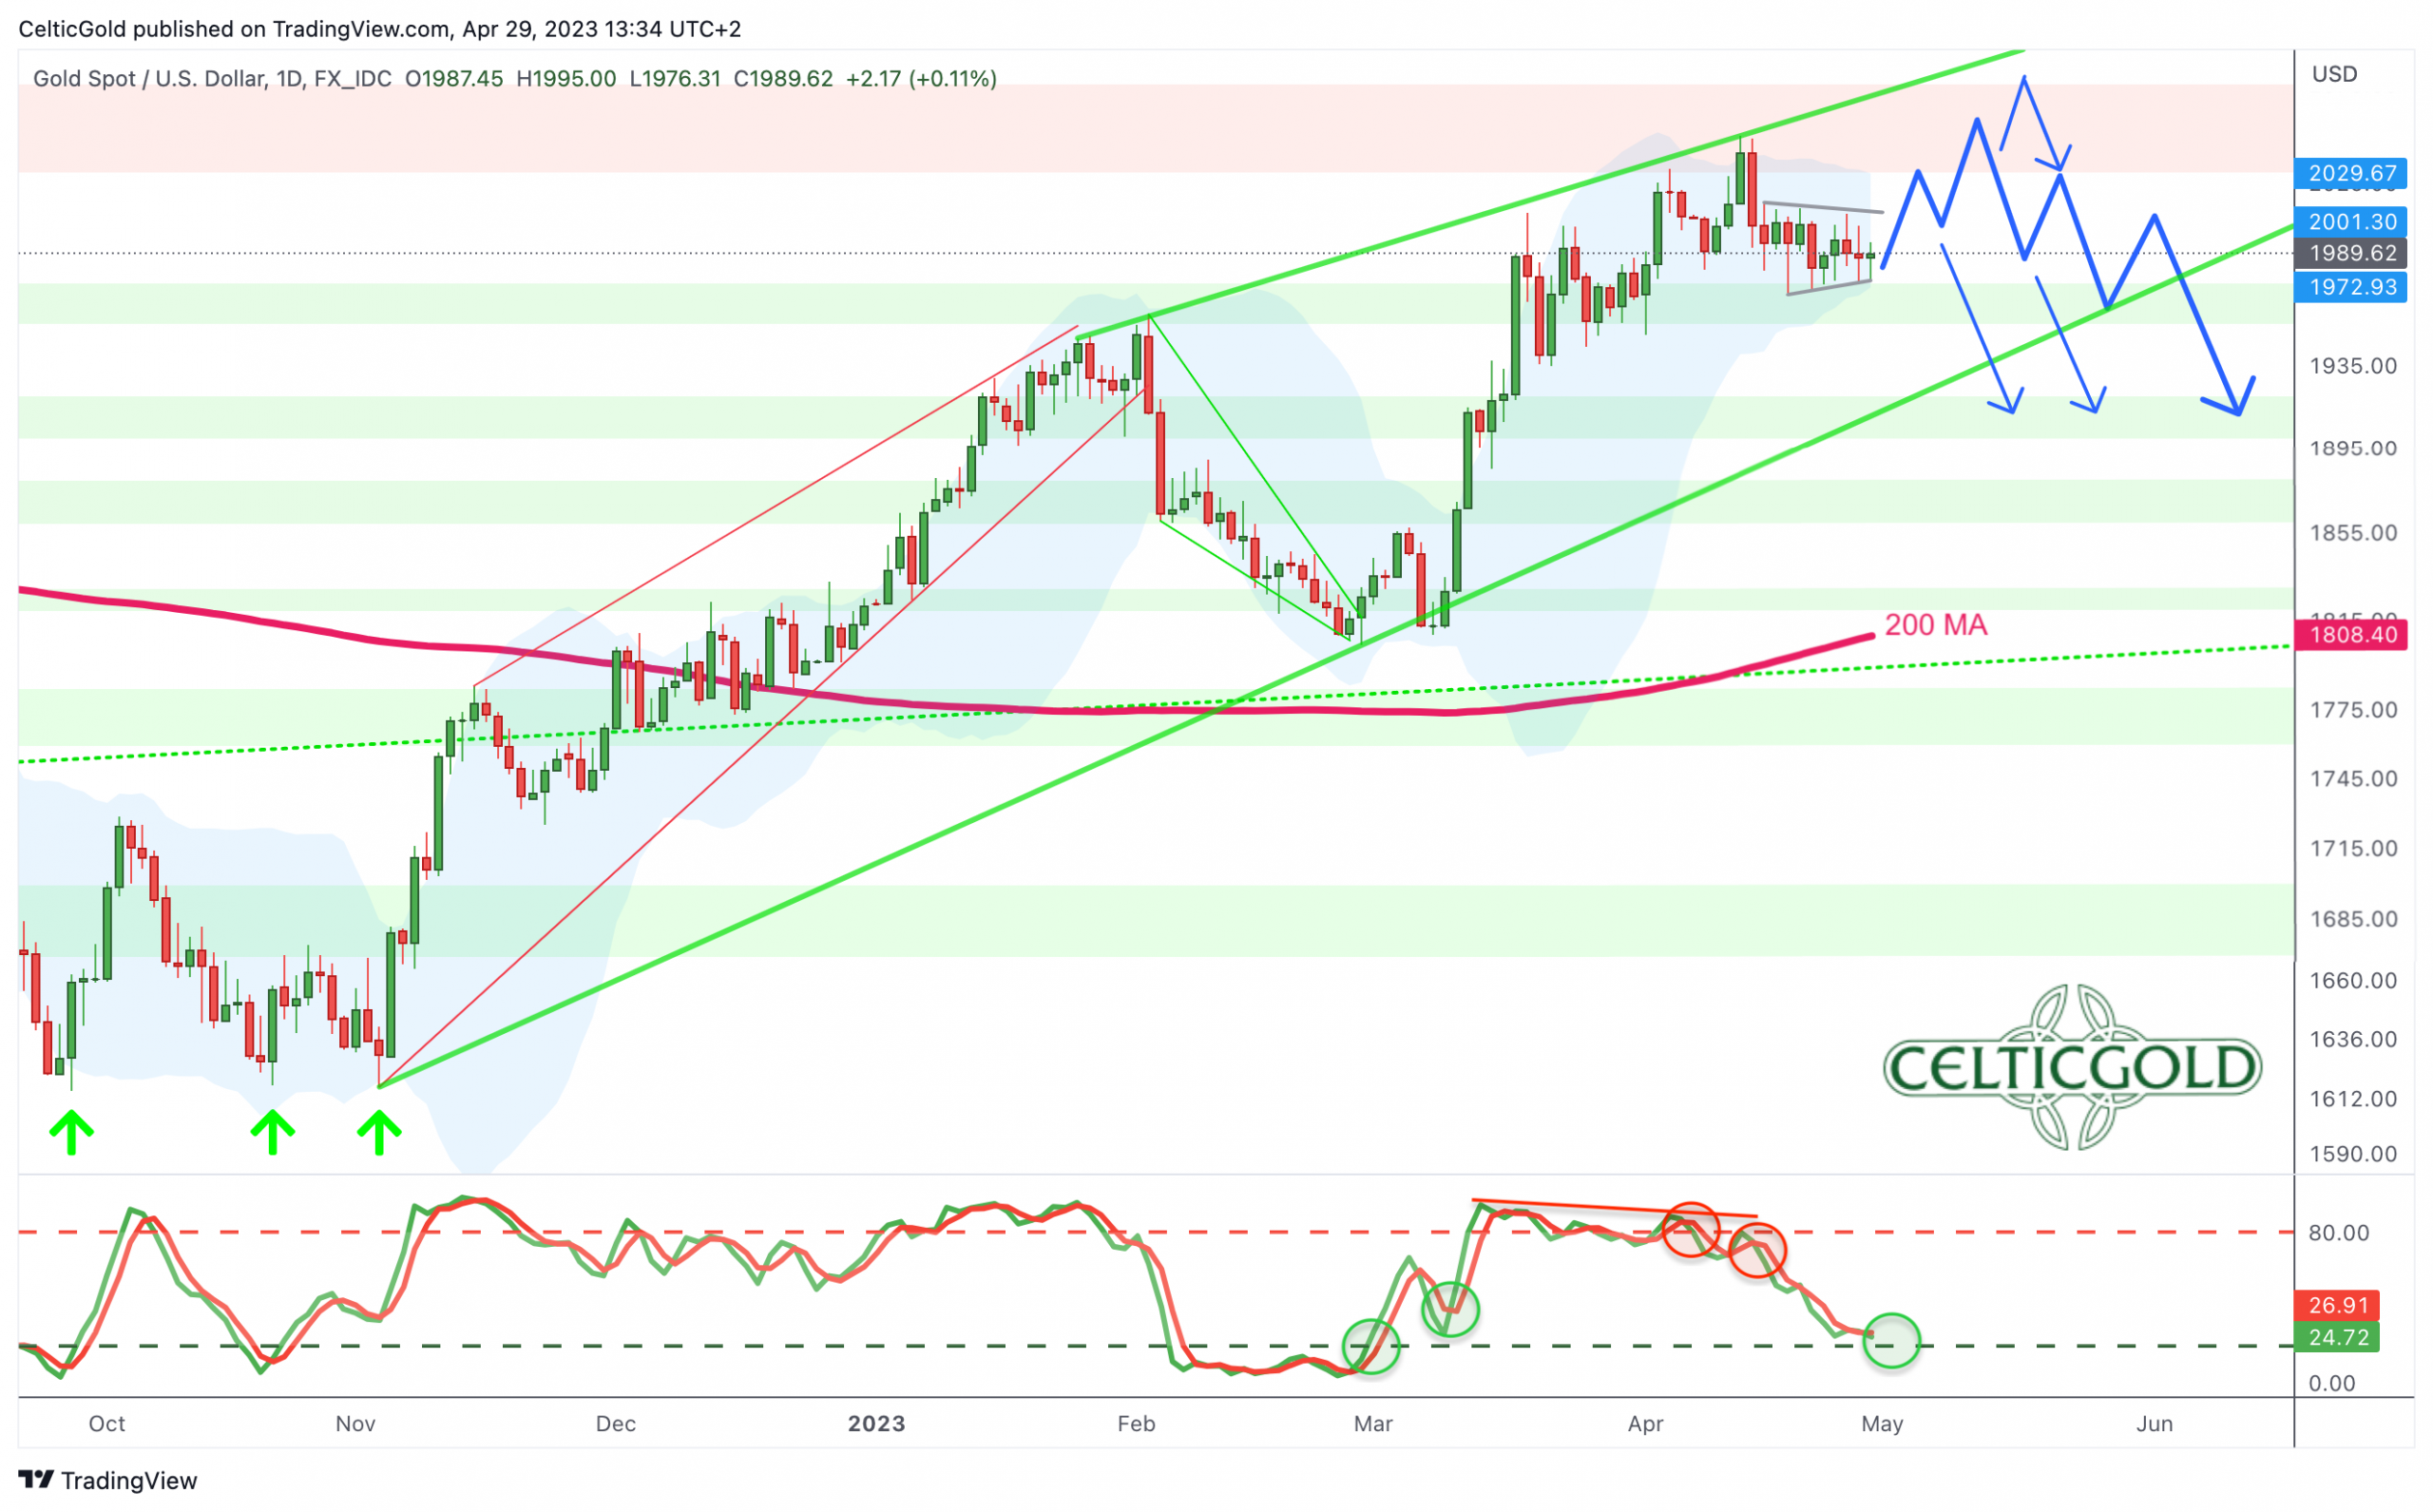
Gold in US-Dollar, daily chart as of April 29th, 2023. Source: Tradingview.
On the daily chart, gold managed to reduce its overbought status through a consolidation at a high level. Actually, the stochastic oscillator is currently approaching the oversold zone without that any dramatic price declines would have been necessary.
Although the directionless choppy sideways trading may have been nerve-wracking for some, a breakthrough to the downside was clearly prevented. Instead, buyers repeatedly entered the gold market and eye contract with the psychological level of 2,000 USD was maintained. Additionally, the lower Bollinger Band (1,968 USD) almost approached the current price action, which will provide more support for the price around 1,970 to 1,980 USD in the coming week.
In total, the chances for another attempt to attack the price region around 2,050 USD in the coming days and weeks are relatively good. Nevertheless, the increasingly parallel moving Bollinger Bands are expected to keep the price action primarily between 1,970 and 2,030 USD for at least another two to three more weeks. Although brief breakout attempts are always possible, they are likely to prove false initially.
Commitments of Traders for Gold
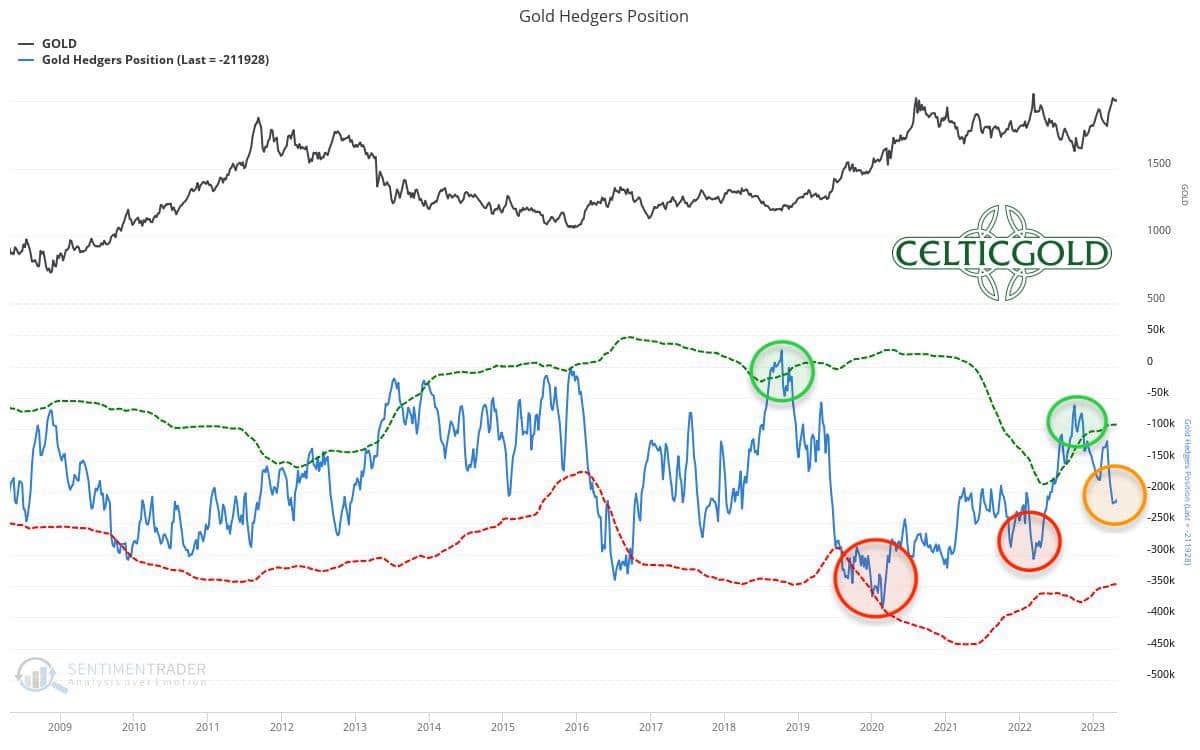
Commitments of Traders (COT) for gold as of April 28th, 2023. Source: Sentimentrader
According to the latest CoT report, commercial traders held a cumulative short position of 211,928 futures contracts as of last Tuesday. In a long-term comparison, though, this short position is relatively high and therefore unfavorable for further bullish price development.
The current CoT report is bearish.
Sentiment for Gold
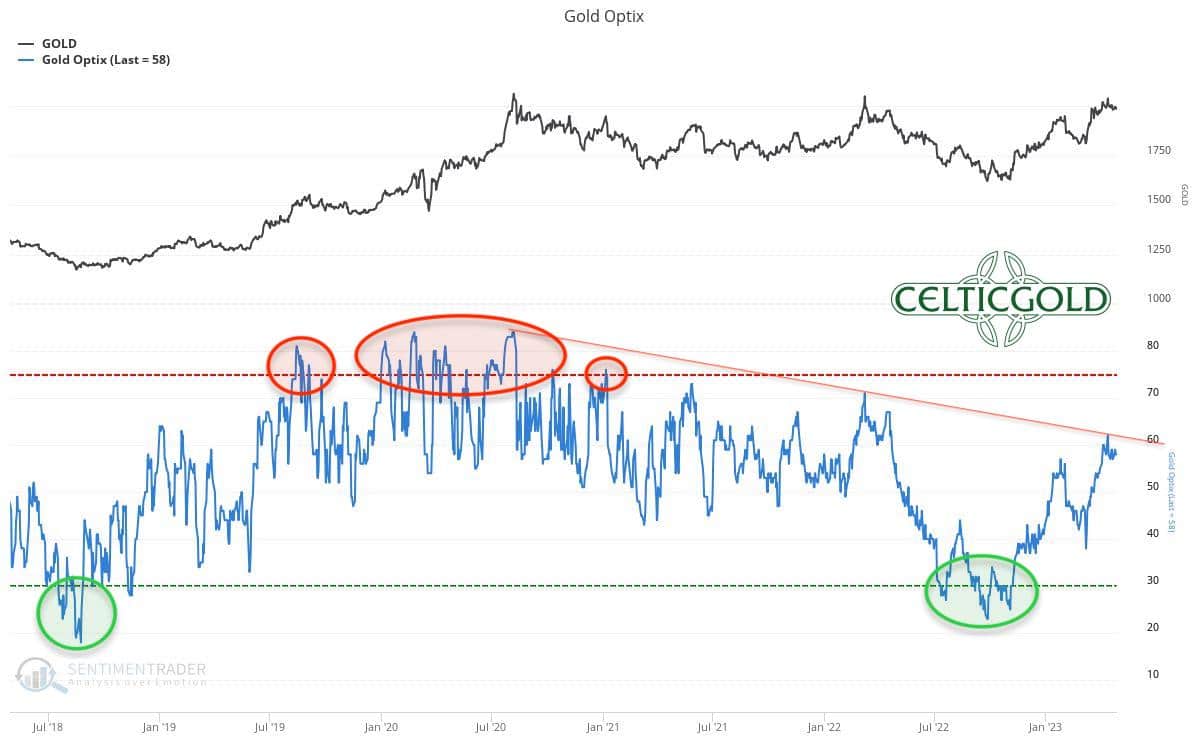
Sentiment Optix for gold as of April 28th, 2023. Source: Sentimentrader
In the big picture, the gold market is still far from euphoria and excessive greed. However, optimism among market participants has significantly increased thanks to the strong recovery in recent months. As well, it is noticeable that gold prices recently tested the old highs around 2,050 USD again, while the sentiment was far from as euphoric as it was during the last two peaks in this price region. This is a good sign for the gold price in the medium term as a sustainable break out to new highs needs enough doubting and uninvested players at the side-lines.
Overall, sentiment remains neutral.
Seasonality for Gold – Topping process followed by a pullback
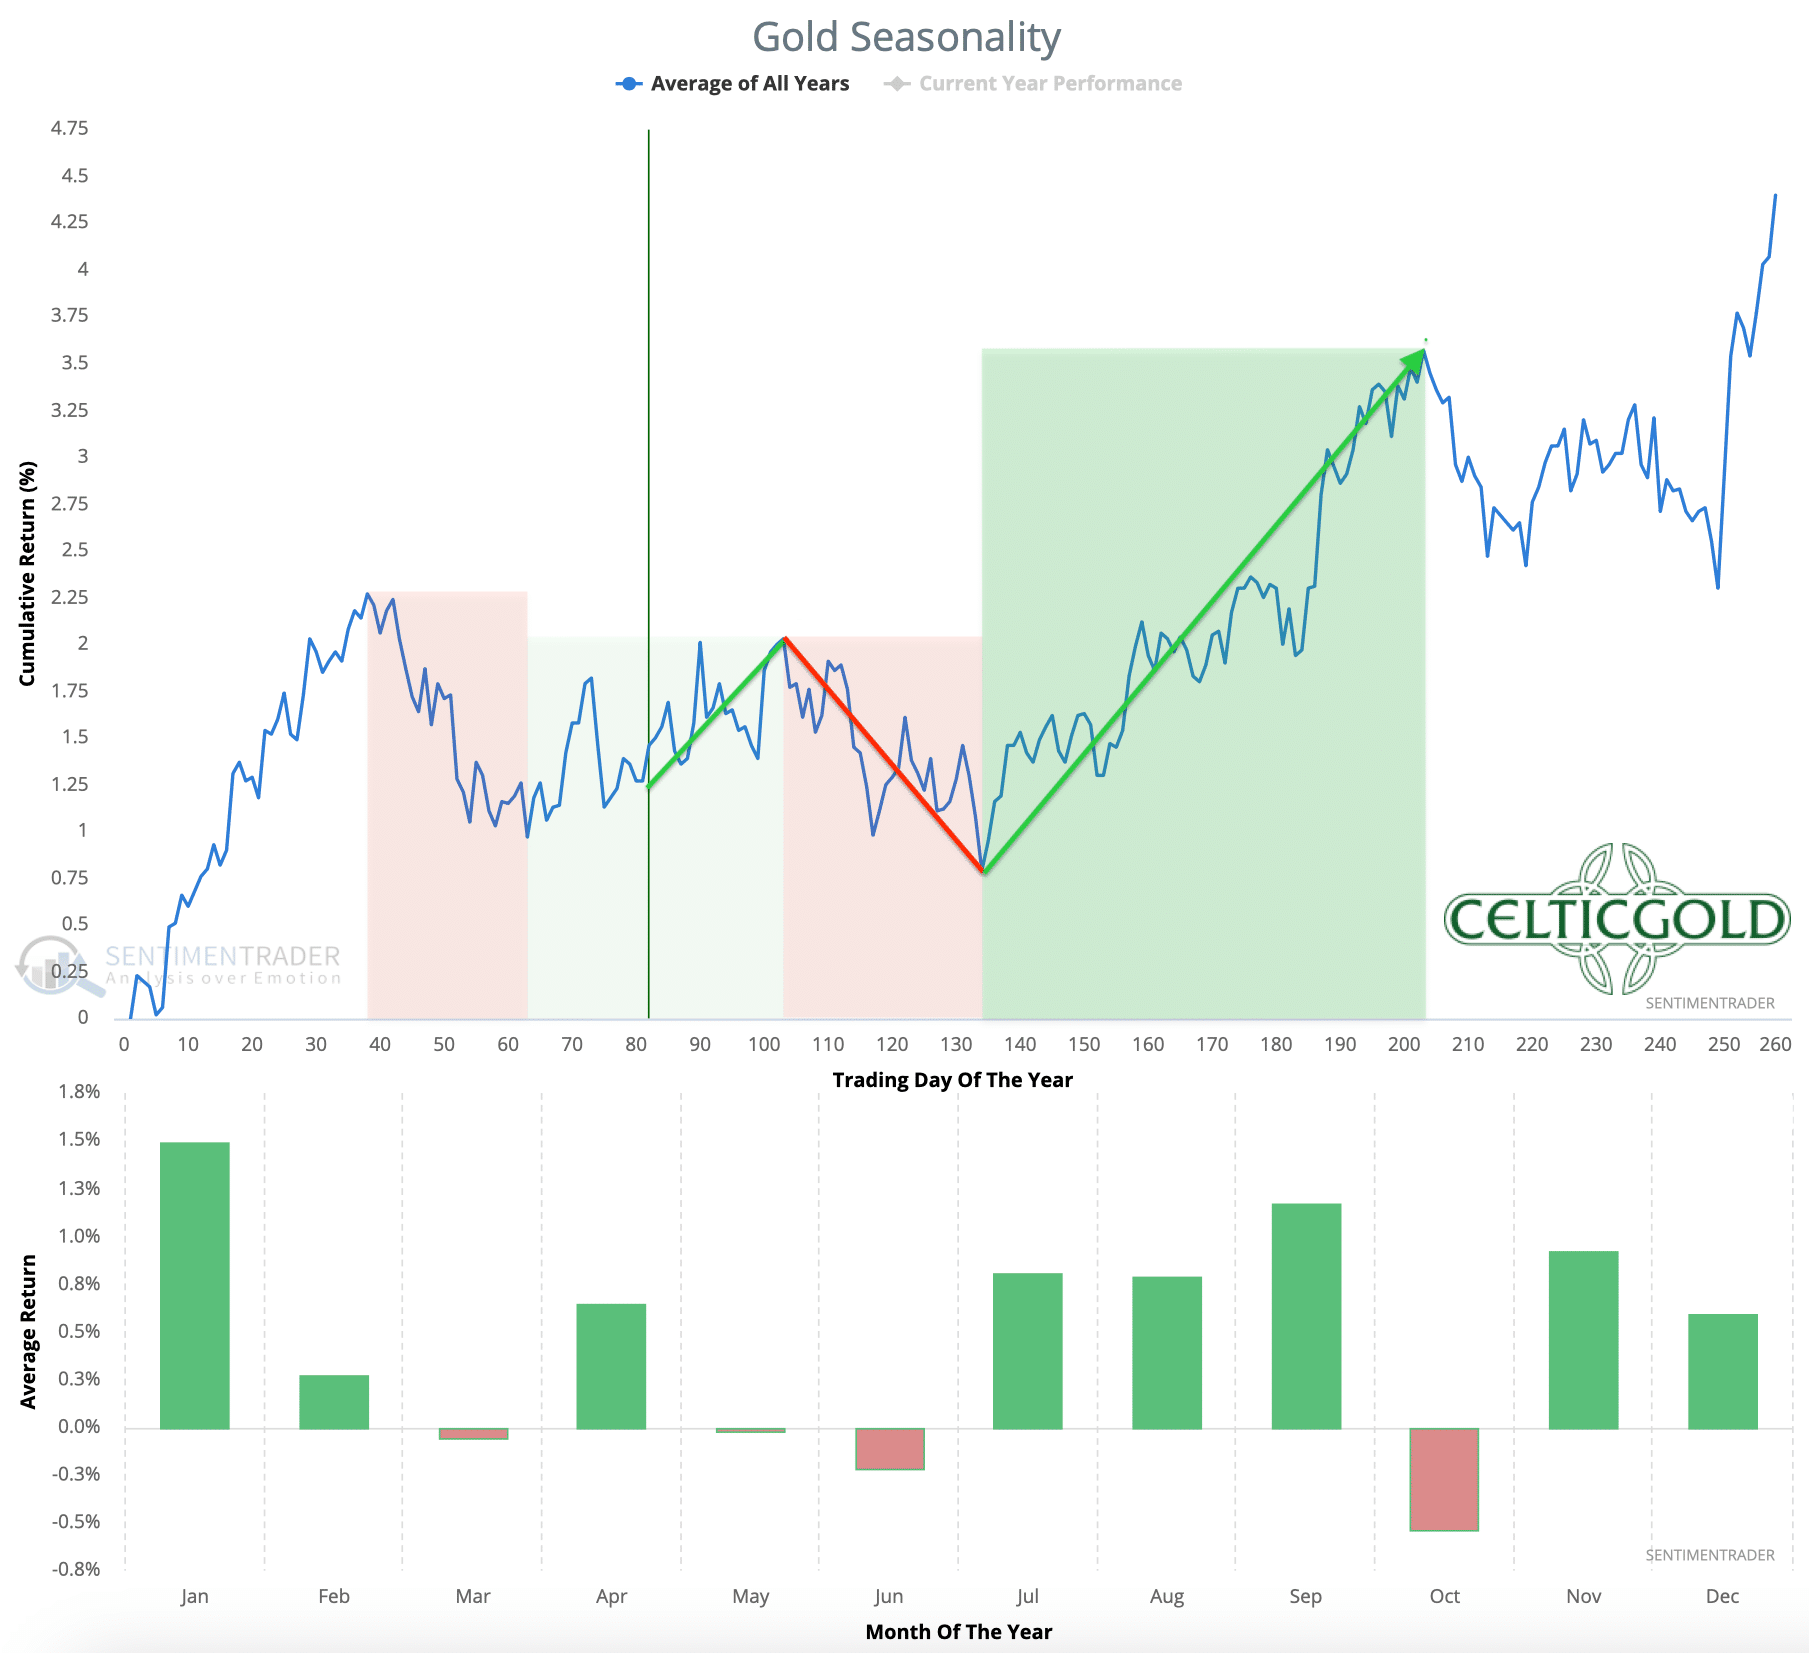
Seasonality for gold over the last 54-years as of April 28th, 2023. Source: Sentimentrader
Since the end of February, gold statistically is in an unfavorable seasonal period. While the first two to three weeks of May usually brought moderate price increases, on average over the last 54 years, sharp pullbacks occurred from the end of May and especially in June.
Therefore, our primary scenario initially sees a few more weeks of rising gold prices and possibly one or two further attacks on the 2,050 USD mark. Subsequently, however, early summer should bring a more significant pullback.
Overall, seasonality is still slightly positive in the short-term, but the situation remains unfavorable until midsummer. In fact, we expect a significant pullback by then, which should also provide the starting point for gold’s best phase of the year, which usually is the third quarter.
Macro update – Banking crisis, dollar crisis, geopolitical crisis, crackup boom
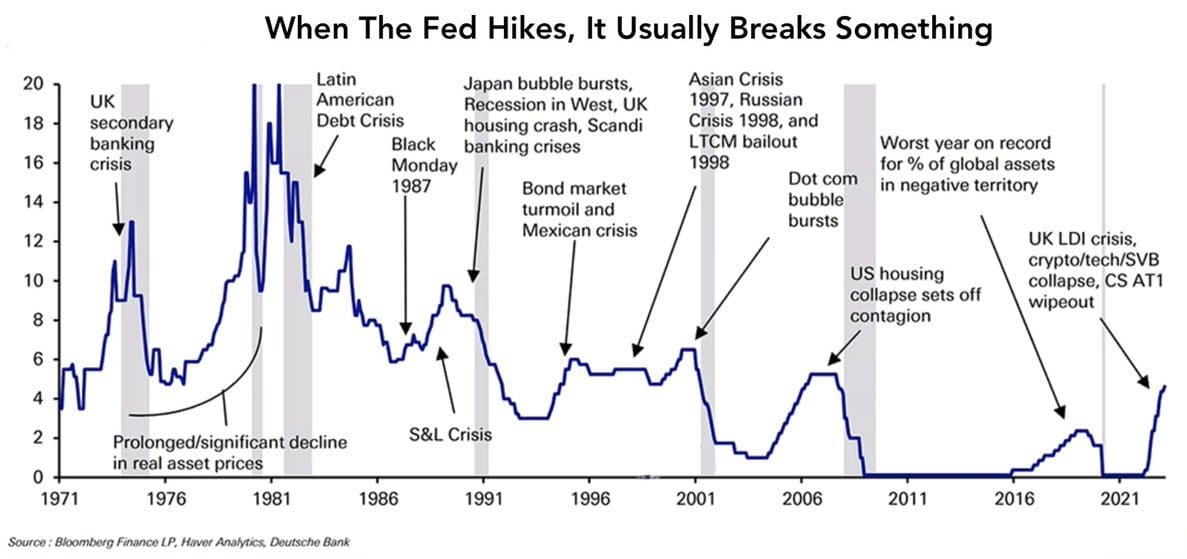
When the Fed hikes, it usually breaks something, as of April 16th. Source: Bloomberg
Over the past 15 months, we have repeatedly stated that the Fed’s aggressive interest rate hikes would eventually break or damage something. It is now clear that this unprecedented hiking cycle has pushed the US-dominated and highly leveraged financial system to the brink of collapse.
This weekend, First Republic Bank will be the next American regional bank to go under. The Federal Deposit Insurance Corporation (FDIC) is currently exploring whether a takeover by JPMorgan Chase, PNC Financial Services, or other banks is possible, which would theoretically allow for the bank’s restructuring following a government seizure.
However, if the San Francisco-based First Republic Bank is placed under receivership, it would be the fourth US bank to collapse within a month after Silvergate Capital, Silicon Valley Bank, and New York’s Signature Bank. The bank’s stock plummeted more than 54% in New York last Friday, following rumors of a government seizure. Since the beginning of the year, the stock has lost over 97% of its value.
The dramatic withdrawal of customer deposits remains the root cause. Instead of leaving their money in a low-interest bank account, investors understandably prefer to buy government bonds and money market funds that offer up to 5% interest. To pay out or transfer these customer deposits, banks must rapidly obtain liquidity, which is often parked in bonds whose current value, due to rising interest rates, is sometimes well below their purchase or nominal value. Reports on social media about difficulties at the banks accelerate the withdrawal of customer deposits and fuel a vicious cycle.
The Fed printed 400 billion new dollars from March 8th to March 22nd!
While the Fed has been trying to correct its past mistakes through interest rate hikes and balance sheet reductions over the past 15 months, it has directly fueled the next crisis with these policies. This new crisis has already forced it to create (print) massive amounts of fiat currency out of thin air and make it available to struggling banks.
Only at first glance these interest rate hikes, balance sheet reductions, and bank failures should have a strongly deflationary effect. But instead, stock indices and cryptocurrencies have all risen significantly in recent weeks and show no signs of starting the expected crash. We assume that this is typical of a crack-up boom, in which the growing loss of confidence is fought with increasingly large support measures, causing the fiat currency to plummet while nominal asset values rise.
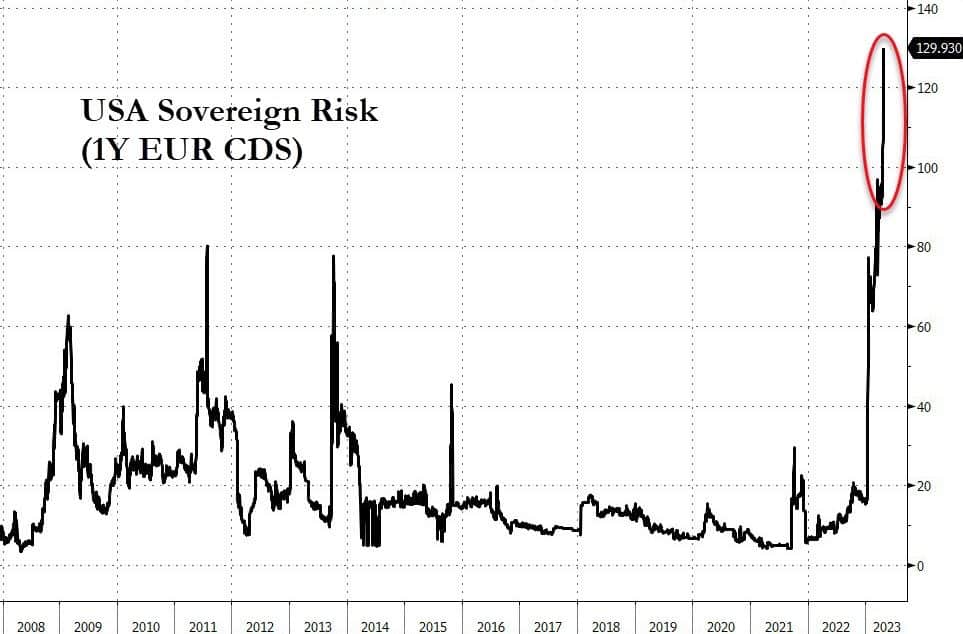
USA Sovereign Risk in form of the 1-year EUR CDS as of April 24th, 2023. Source: Zerohedge
Furthermore, the toxic mix of the Ukraine conflict, energy crisis, increasingly overt warmongering between the US and China, exorbitant US national debt, the US debt ceiling and the resulting dollar crisis, plus growing recession risks, high global inflation rates, as well as the ongoing banking crisis and the recent bank run in the US, all accelerate the rapidly growing loss of trust. This can be seen particularly in the weakening US dollar and the exploding credit default swaps (CDS). Although these CDS are mainly purchased by banks to hedge potential default risks for regulatory reasons, this small market sector reflects quite well what is really going on in the financial system.
King Dollar – The end of his reign means Gold’s renaissance.
King Dollar – The end of his reign means Gold’s renaissance.
In these uncertain times, not only private investors but also institutional investors and especially central banks are turning to precious metals. While the tasks of a central bank may differ depending on the country or currency area, the central task of a central bank is generally to ensure price level stability in the associated currency area and to control the circulating money or to control the money supply in an economy.
To fulfill this task, numerous central banks already bought a record amount of 1,136 tons of gold worth around 70 billion USD last year. Due to the rapidly diminishing US influence on Saudi Arabia and its new alliance with China and Iran, more and more central banks are likely to be forced to diversify their portfolios away from the US dollar in the near future. This process could accelerate in the coming years and easily drive up the gold price to 3,000 USD and higher.
There is no doubt that we are living in historic times. Only with a clear commitment to free and open (financial) markets, including necessary competition, and a free market money backed by tangible assets like gold and Bitcoin, as well as a free and open society in which every free expression of opinion is an essential human right, does the Western alliance centered around America still have a chance against the totalitarian alliance of China and Russia. Instead of relying on freedom and market economy, the US is trying to maintain its global hegemony through aggressive military power projection. The accumulation of aircraft carriers and military machinery in and around Taiwan speaks volumes!
Conclusion: Gold – Topping process followed by a pullback
After a rise of over 430 USD over the last six months, the air for the gold price appears to be thinning in the short term. It is likely that the bulls will make another attempt to break through the resistance level of 2,050 USD, and perhaps there is even enough strength for a brief run towards the all-time high at 2,075 USD. However, given the overbought situation on the weekly chart and the unfavorable seasonal component, a significant pullback towards 1,900 to 1,930 USD would be expected afterwards. Additionally, the open price gap in the gold futures (June future at 1,889 USD) may also be closed during this time.
More By This Author:
Bitcoin – Every Pullback Is A Buying Opportunity
Bitcoin – Next Target 30,000 USD
Gold – Rally Is Losing Momentum
Disclaimer: All published information represents the opinion and analysis of Mr Florian Grummes & his partners, based on data available to him, at the time of writing. Mr. Grummes’s ...
more

