
Gold – Rally Is Losing Momentum
Just a few months ago, financial markets had been under severe pressure, driven by a rising interest rates and a stronger US-Dollar. Yet, since November, nearly all markets have been able to recover significantly. Gold and silver prices have not only recovered strongly but were among the best-performing assets of the last three months. Gold – Rally is losing momentum.
Review
So far, gold has started very strongly into the new trading year. From the closing price of 2022 (1,824 USD), a more than respectable rally of 125 USD respectively 6.9% has made its way. Since the triple bottom around 1,615 USD at the beginning of last November, the recovery of over 330 USD (+20.5%) is even more impressive.
Primarily, this rally is likely to be because that gold prices were extremely oversold in November after seven red monthly candles and a pullback of 455 USD or -22%. In addition, short covering, as well as a general easing in financial markets together with the reopening of China as well as the escalating geopolitical situation with the advancing trend to move away from the Petrodollar plus the U.S. reaching its debt ceiling, provided lots of reasons for the strong recovery over the last three months.
Silver consolidates for final spurt
While gold is working its way from one high to the next, silver has been running sideways between 23 USD and 24.20 USD since mid-December. Earlier, however, silver had already reached its low on September 1st at 17.56 USD and was able to recover by almost 40% within three months.
(Click on image to enlarge)
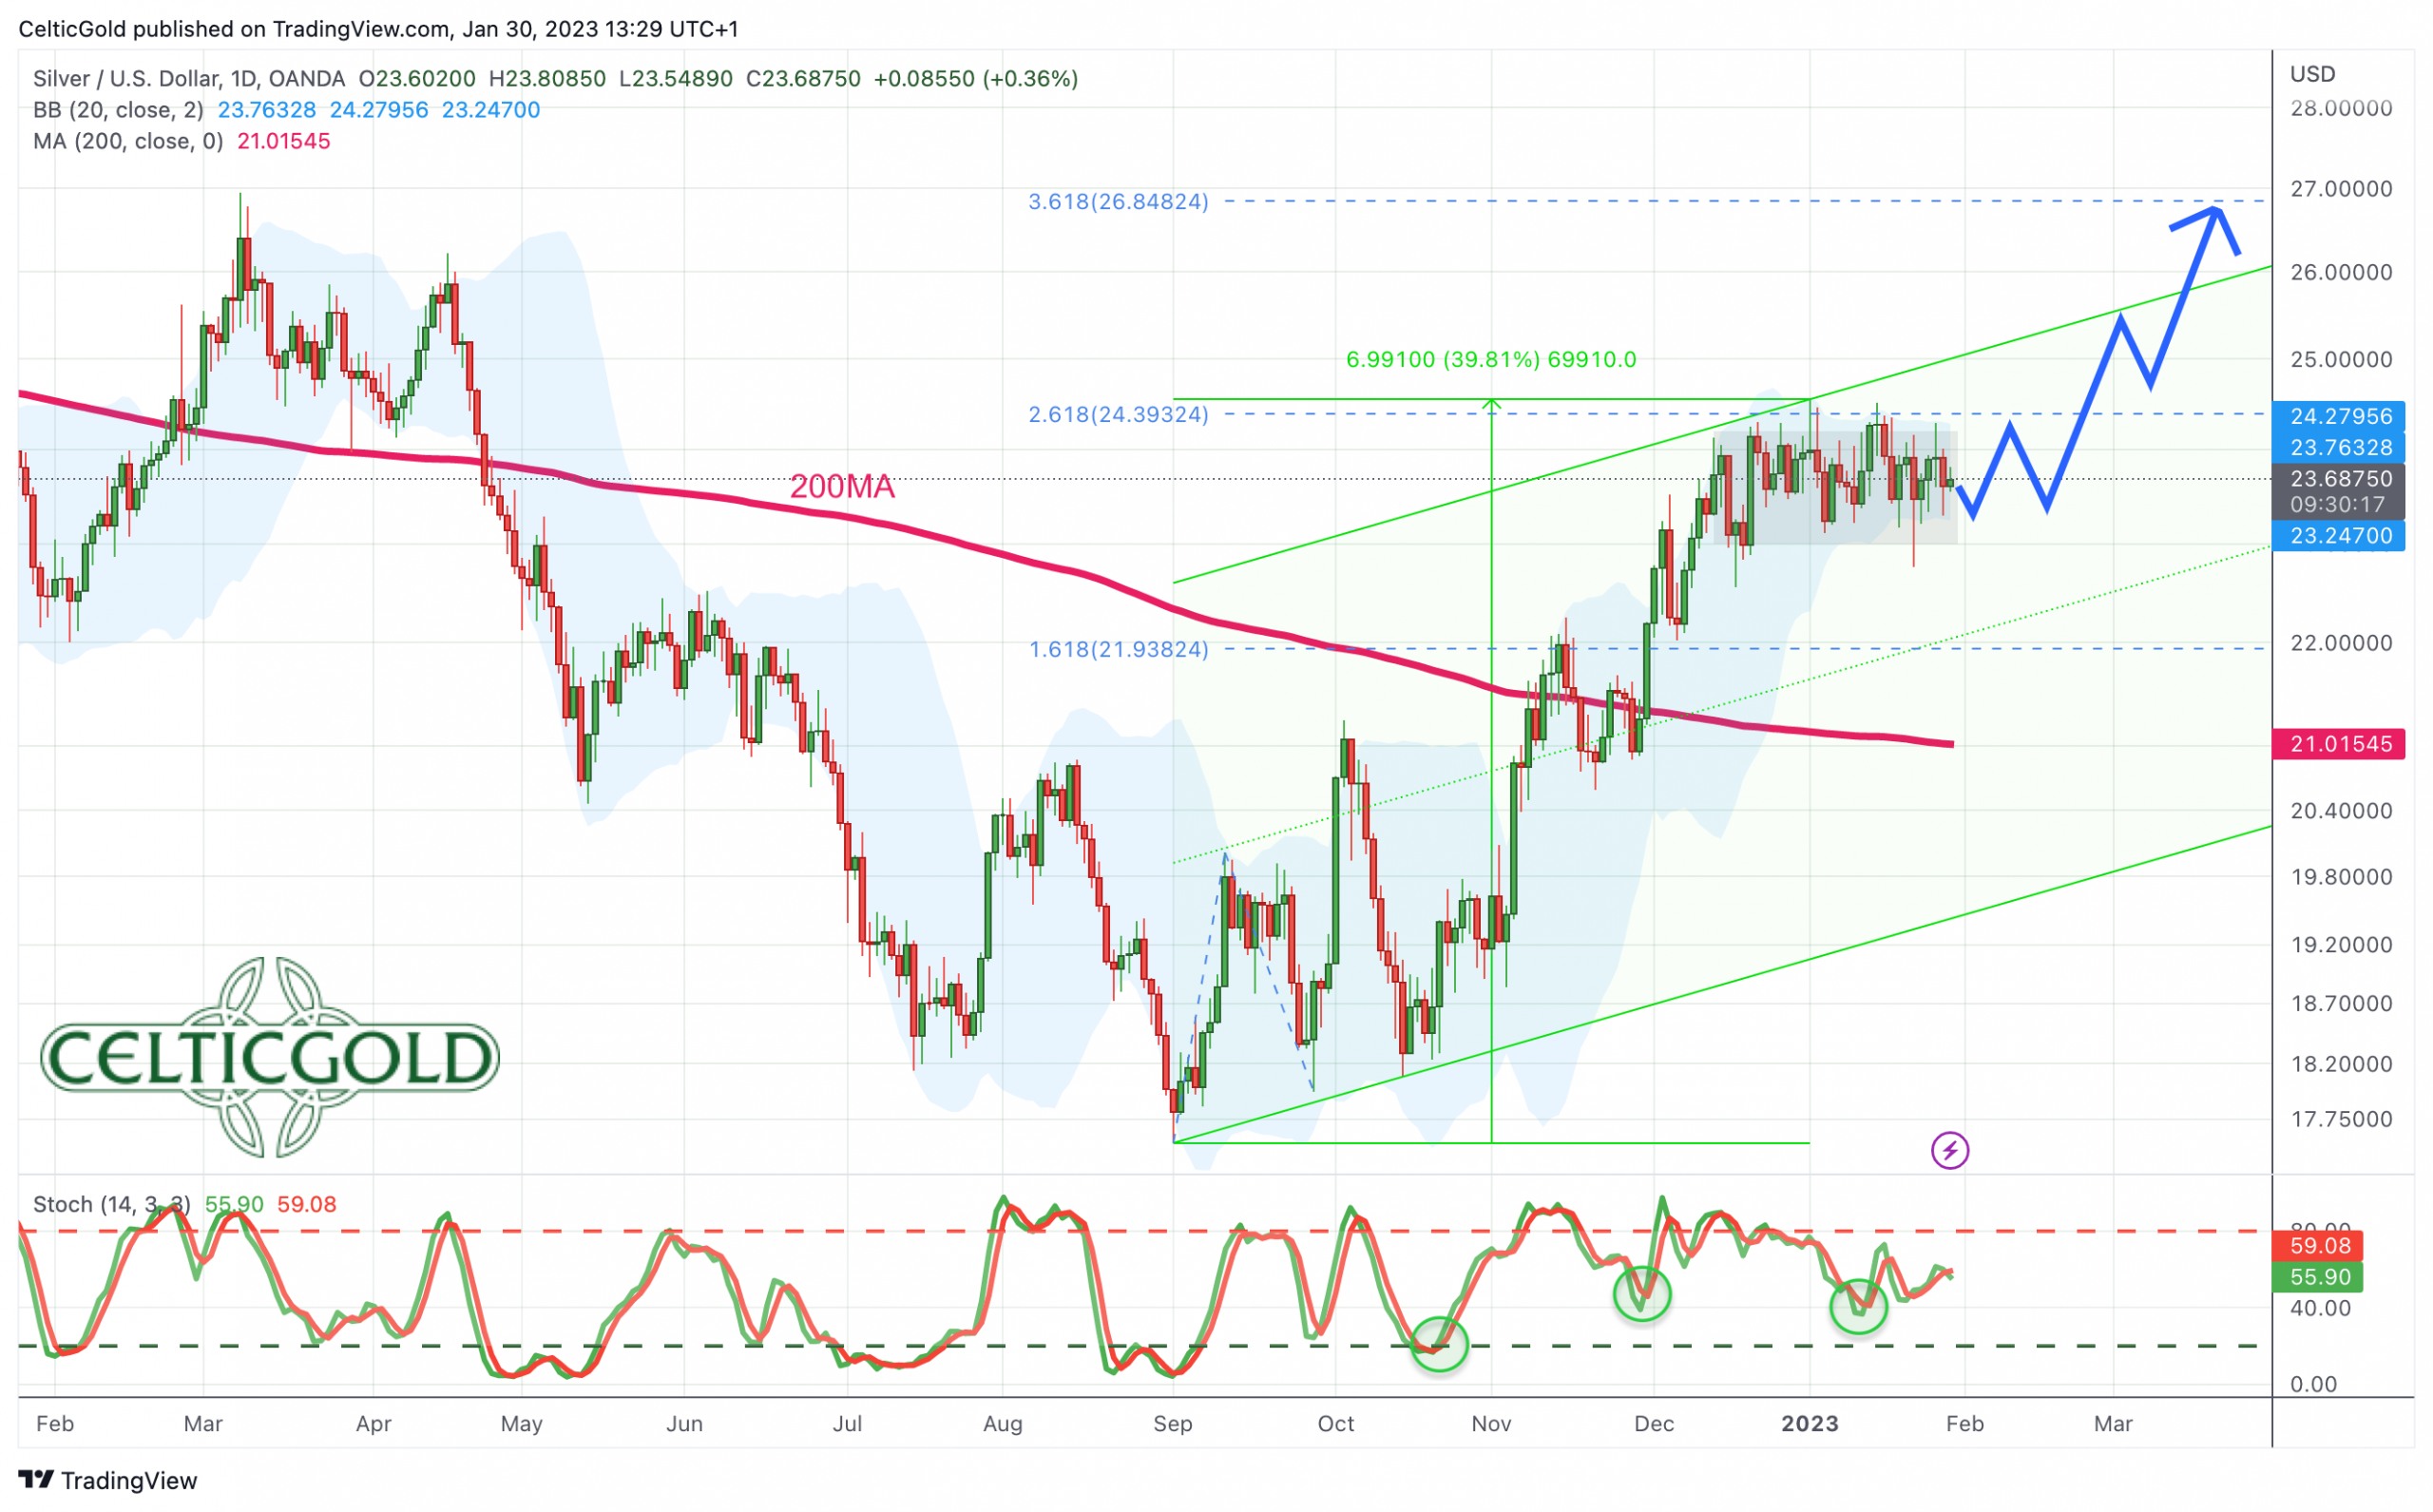
Silver in US-Dollar, daily chart as of January 30th, 2023. Source: Tradingview
The several weeks long consolidation in the silver market continues to leave a bullish impression and could lead to a breakout in the coming weeks. Conceivable price targets would be sitting around 27 USD and possibly even 30 USD. Should such a bullish breakout occur in February or March, a significantly rising silver price would probably herald the temporary end of the current rally in the precious metal sector. After all, typically from the end of February or mid-March, the sector usually reaches an intermediate high, which is followed by a correction or at least a pullback lasting several months. Likewise, silver tends to show up with some incredibly strong advances just before the end of a multi-months rally in the precious metals sector.
Chart Analysis – Gold in US-Dollar
Weekly chart: The air is getting thinner
(Click on image to enlarge)
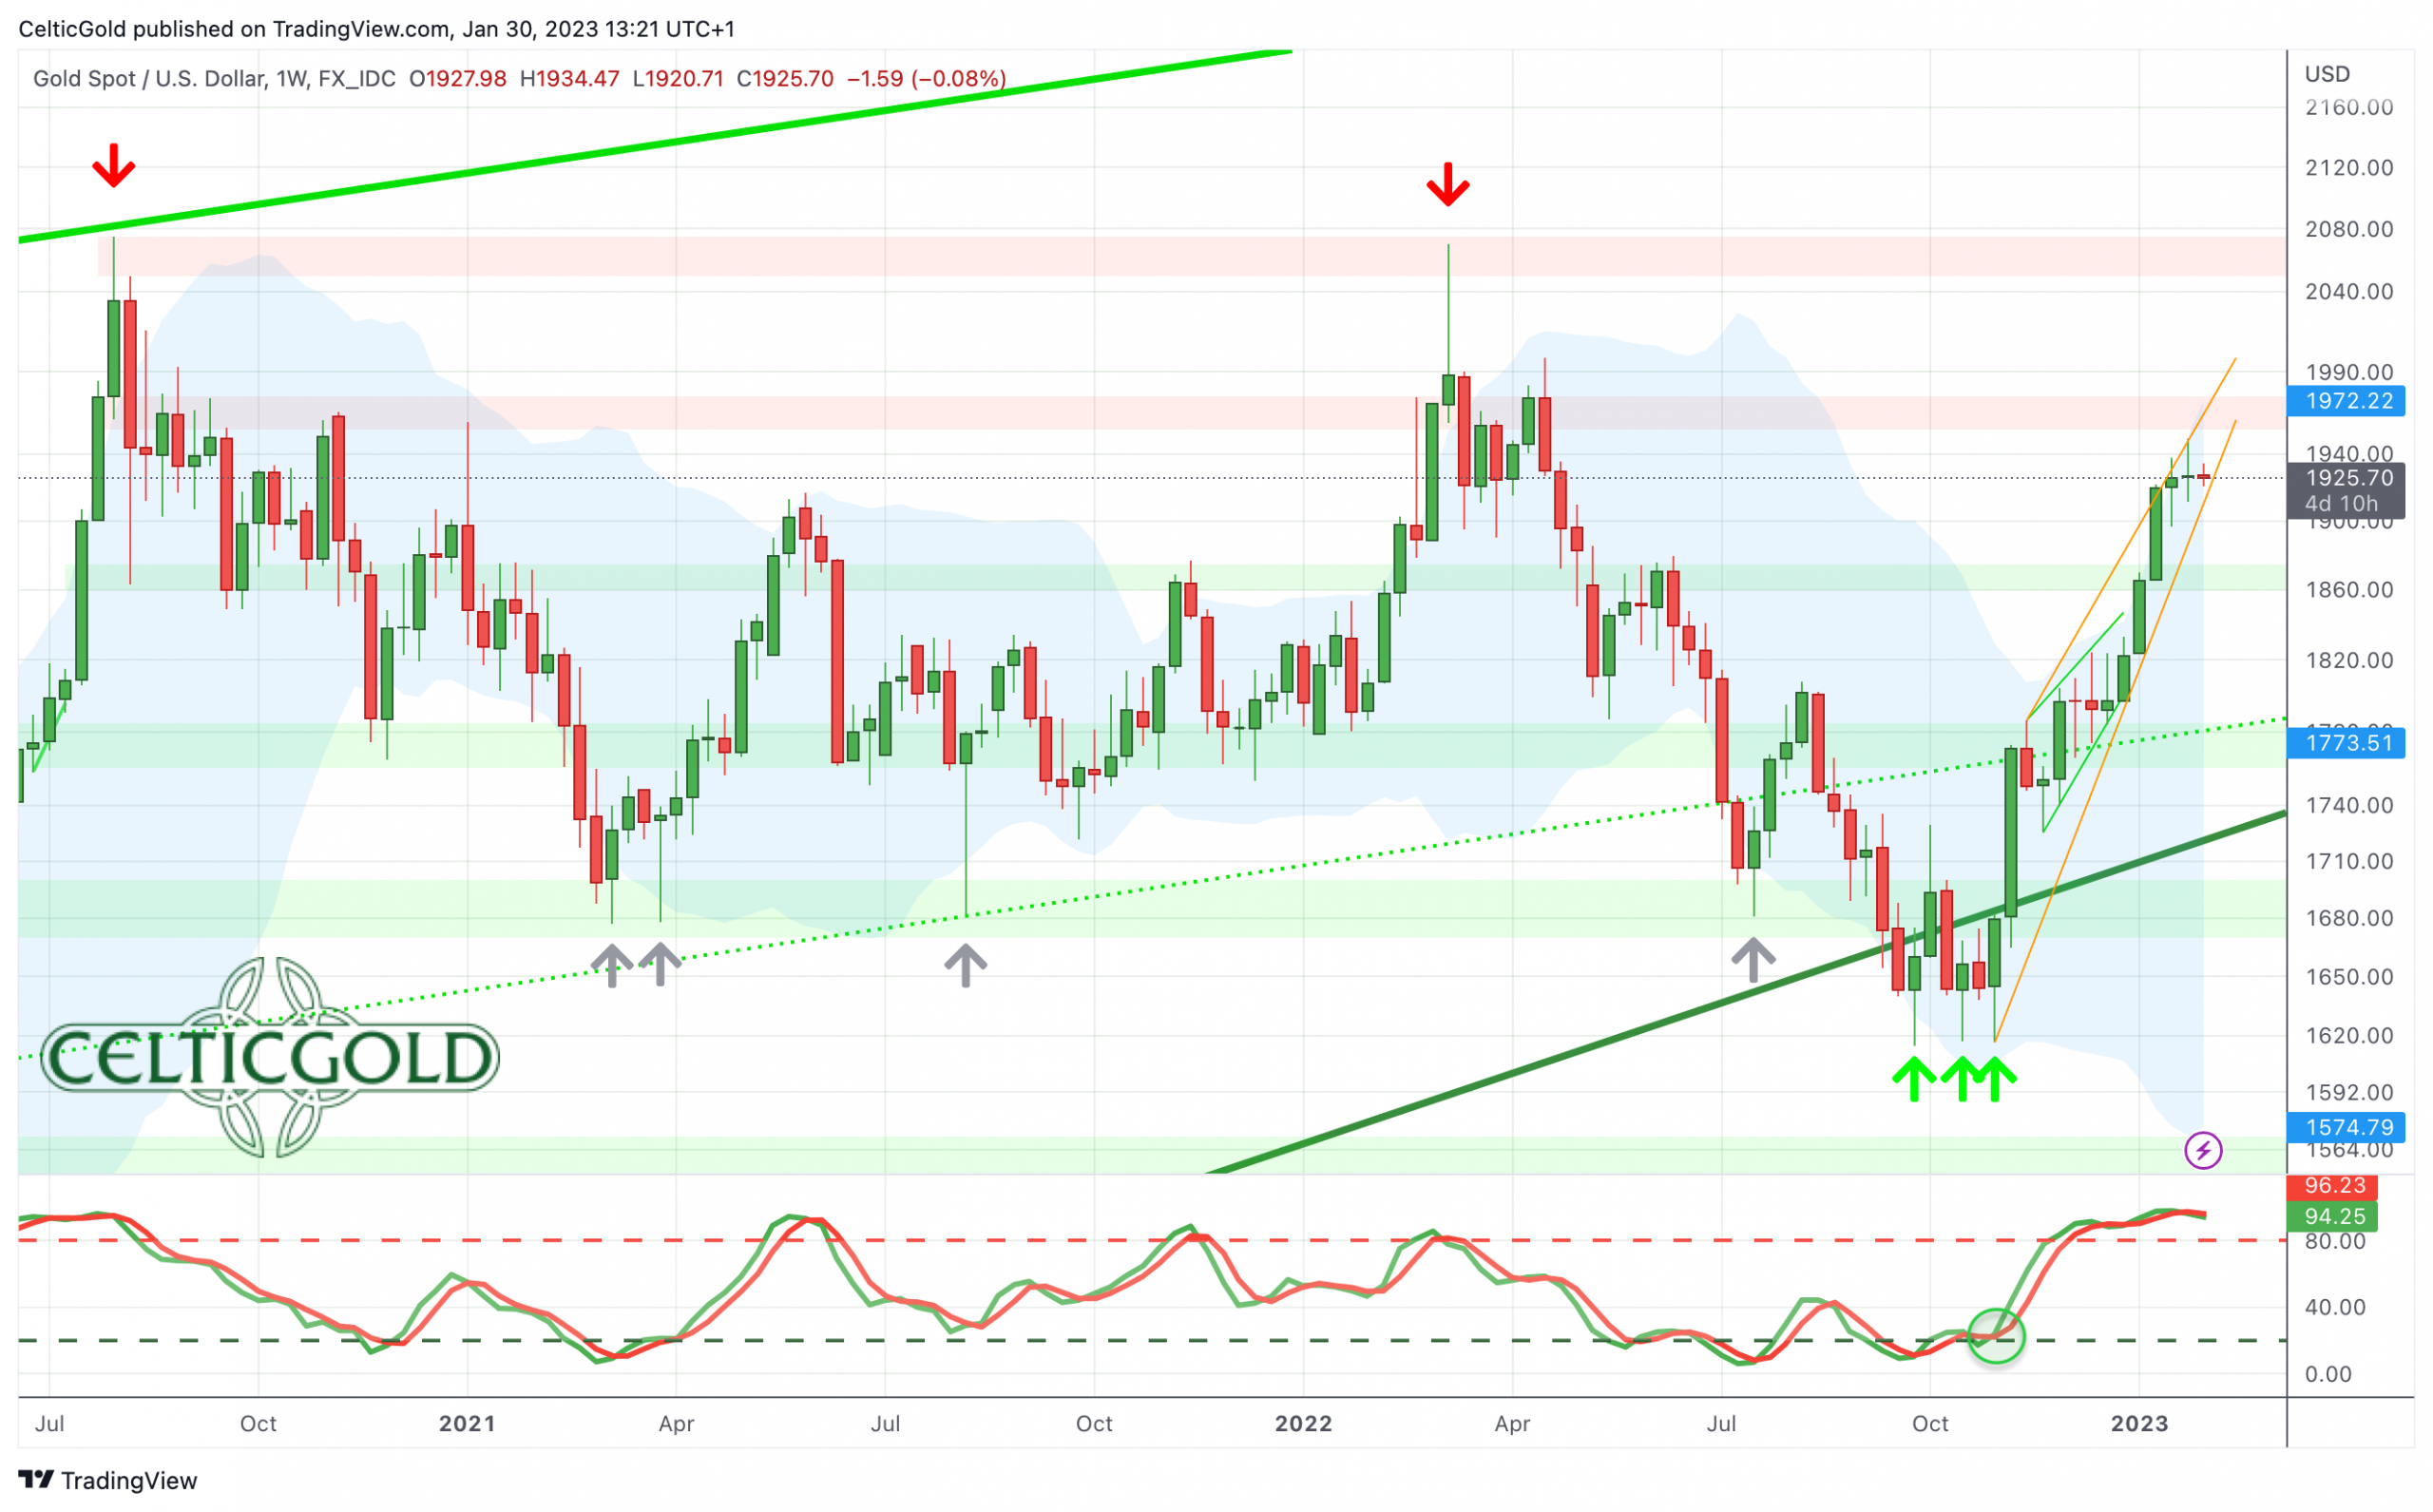
Gold in US-Dollar, weekly chart as of January 30th, 2023. Source: Tradingview
The impressive recovery in the gold market is particularly obvious on the weekly chart. Prices have been pushing up steeply for almost three months without any major pullbacks. The upper Bollinger Band was already bent upwards in mid-November and currently would still provide room for a run towards approx. 1,973 USD. The stochastic oscillator at 96 is sitting almost at the top, but at the same time has locked in the uptrend for now.
The next resistance zone is waiting between 1,950 and 1,975 USD. In addition, the round psychological mark of 2,000 USD acts as a magnet and resistance. However, in the big picture the decisive resistance is waiting around the all-time high between 2,050 and 2,075 USD.
Despite the strong recovery, gold is still missing the final exaggeration on the upside. This could take place in the coming weeks, in line with the seasonal pattern. At the same time, however, the air has become increasingly thin and a failure around 1,950 USD around the next FOMC interest rate decision would be conceivable, too.
Overall, the weekly chart is still bullish, but patience and restraint are recommended now in view of the hot situation. In any case, there will be at least one significant setback by early summer, which would then deliver a much better risk/reward ratio.
Daily chart: Gold – Rally is losing momentum
(Click on image to enlarge)
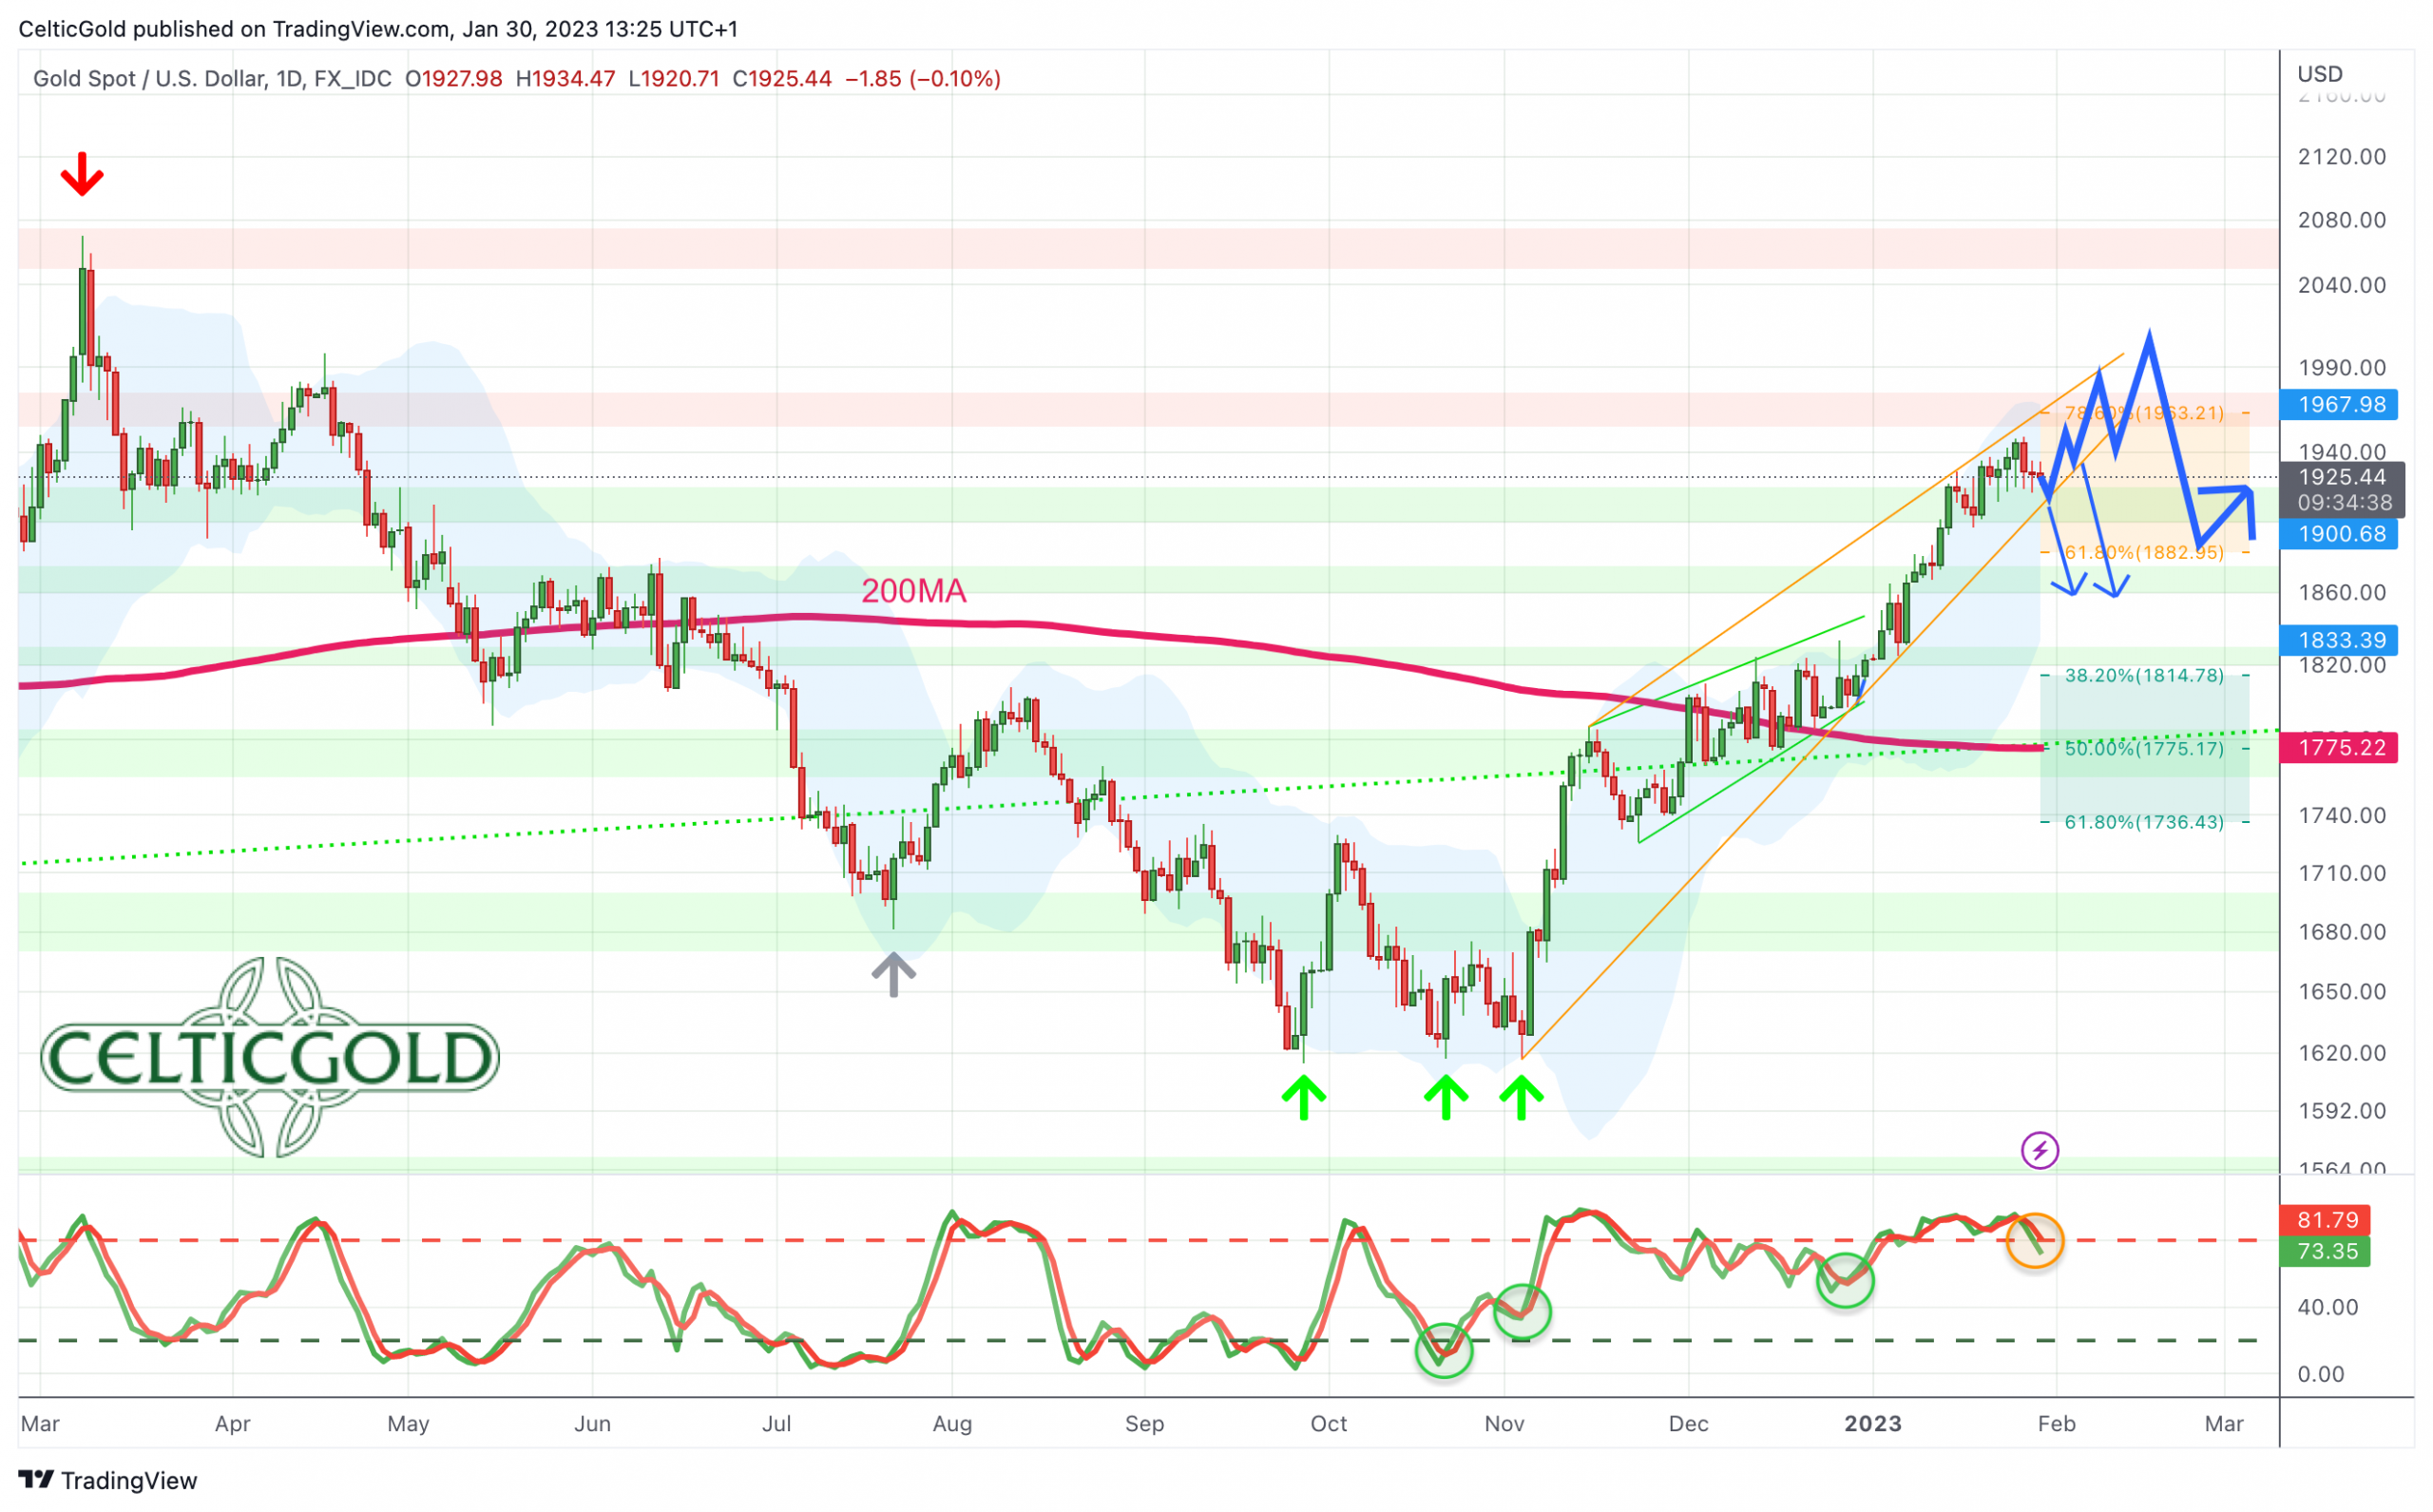
Gold in US-Dollar, daily chart as of January 30th, 2023. Source: Tradingview
After a multi week intermezzo, gold was able to leave behind its 200-day moving average (1,776 USD) shortly before Christmas. Since then, prices have been rushing higher. Over the last two weeks, the rally has been starting to stutter a bit again, though. Although a new high was achieved last Wednesday, the momentum is fading.
This fact is confirmed by the stochastic oscillator losing its bullish embedded status. The faster line (73) has now dipped below 80. Hence, the bullish embedded status has now been lost in the spot market, while the daily gold future still is bullish embedded. A pullback in the direction of at least 1,900 USD, but more likely towards 1,850 to 1,880 USD, becomes more and more likely but is not yet confirmed.
Overall, the daily chart is now sending a warning signal, despite new buyers still holding prices above 1.920 USD. Obviously, after a rally of over 330 USD, a breather would be quite logical and healthy.
Commitments of Traders for Gold – Neutral
(Click on image to enlarge)
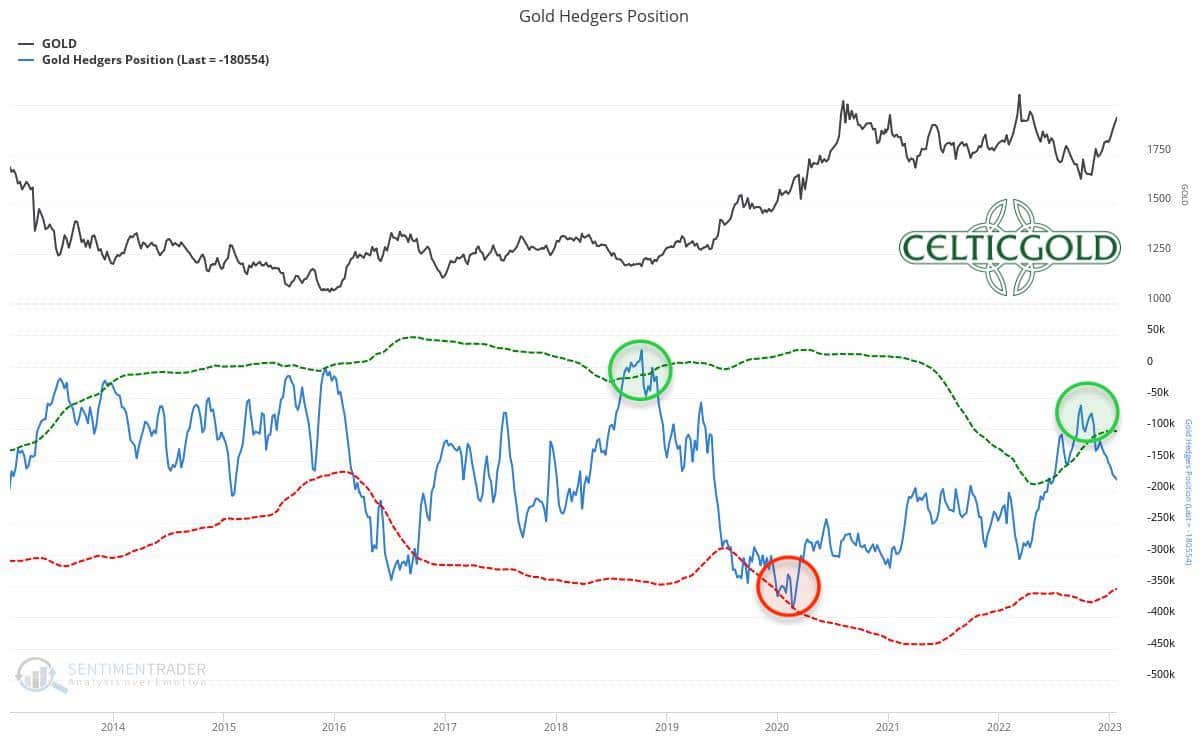
Commitments of Traders (COT) for gold as of January 27th, 2023. Source: Sentimentrader
According to the latest COT report from January 24th, the net short position of commercial market participants amounted to 180,554 cumulative short contracts. Thus, the situation in the gold futures market has further deteriorated, and the COT report sends first warning signals.
In summary, however, the COT report can be classified as neutral.
Sentiment for Gold – Neutral
(Click on image to enlarge)
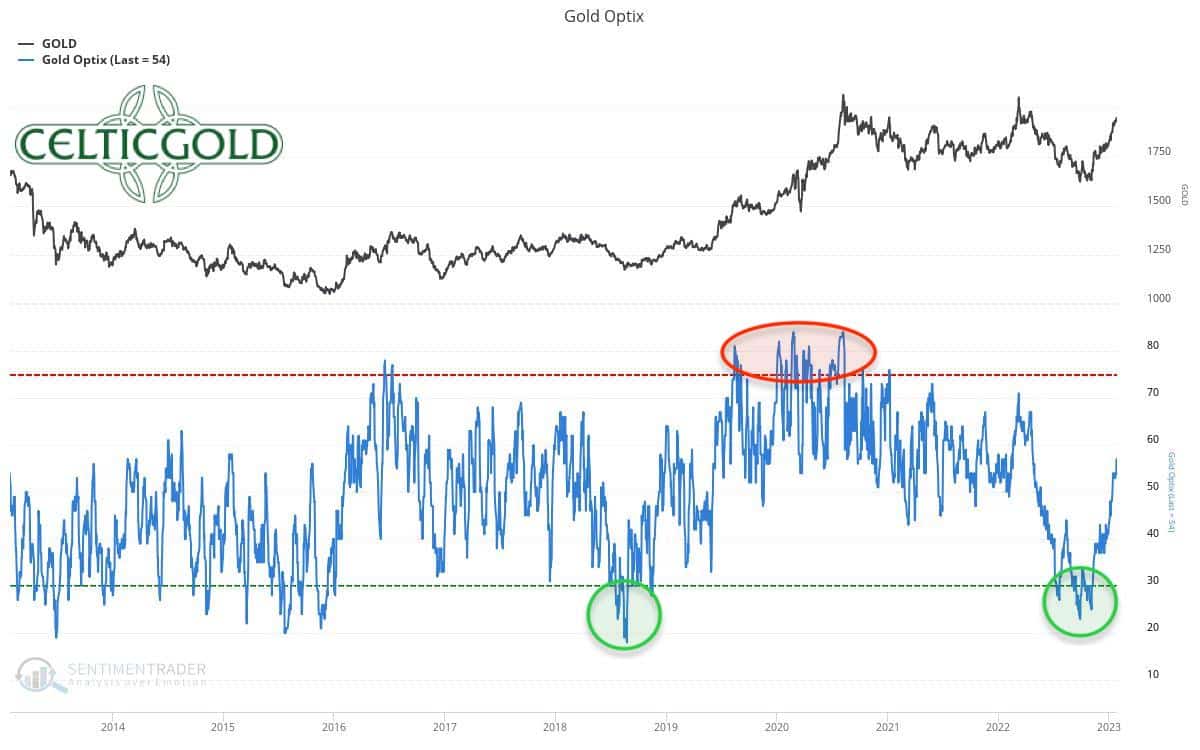
Sentiment Optix for gold as of January 27th, 2023. Source: Sentimentrader
In parallel to the sharp recovery over the last three months, sentiment in the gold market has brightened considerably, too. With an Optix value of 54, sentiment is currently neutral. From a contrarian perspective, though, there would still be enough room to the upside before an overly optimistic sentiment is likely to cause a major pullback.
Overall, sentiment for gold is neutral.
Seasonality for Gold – Bullish until the end of February
(Click on image to enlarge)
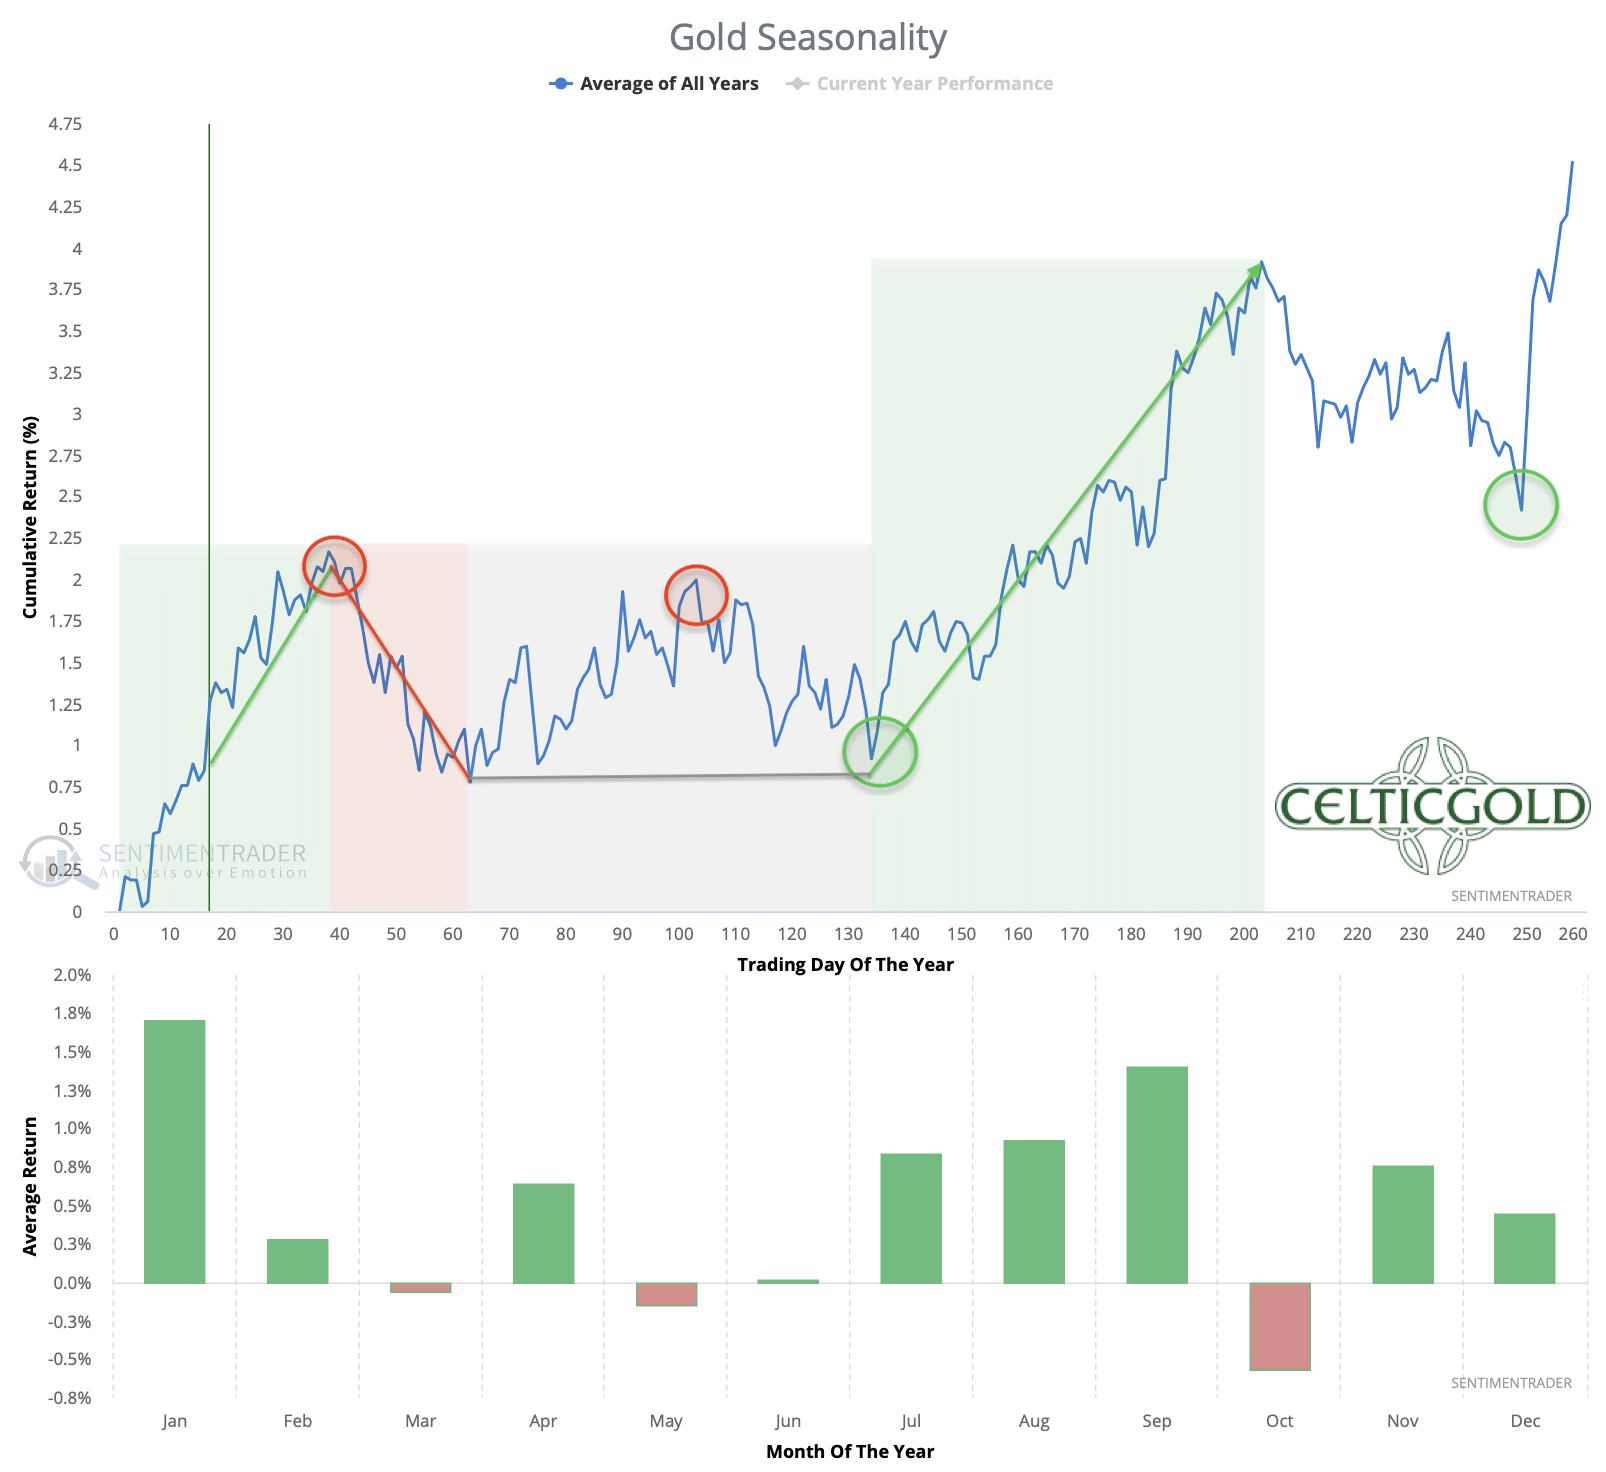
Seasonality for gold over the last 54-years as of January 27th, 2023. Source: Sentimentrader
Until late February or even mid-March, the seasonal pattern is still favorable for precious metals prices. In the past, significant price increases have been seen during this period. From mid-March at the latest, however, statistics then turn, and precious metal prices are likely to come under pressure until early summer.
The seasonality for gold and silver prices is bullish until the end of February.
Macro update – The calm before the next storm?
(Click on image to enlarge)
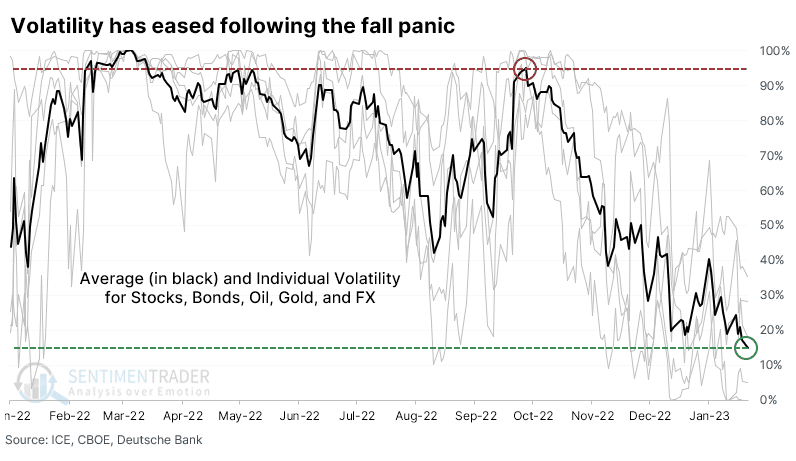
Volatility on the financial markets falls; from January 24th, 2023. Source: Sentimentrader
Panic-like conditions prevailed in the financial markets until mid-October 2022. Volatility in stock, bond, forex and commodity markets had exploded in August and September. In the meantime, however, the situation has calmed down considerably and volatility for many assets is at the lower end of the last 12 months. Statistically, such behavior mostly led to moderately rising prices for all assets.
At the same time, however, the restrictive central bank policy continues unabated. The effects of the aggressive interest rate hikes and balance sheet reductions by the Fed and ECB are likely to be felt in the real economy with a delay of at least 12 months. Mass layoffs (Microsoft, Google, Amazon, Spotify, Salesforce, SAP, etc.) are already increasing significantly as of late. Despite the relatively robust economic situation so far, the U.S. should slide into recession in the coming months. It can be assumed that there will be increasing problems from the summer onwards, which financial markets will price in early on, as always.
U.S. 1 year Credit Default Swap is going vertical
(Click on image to enlarge)
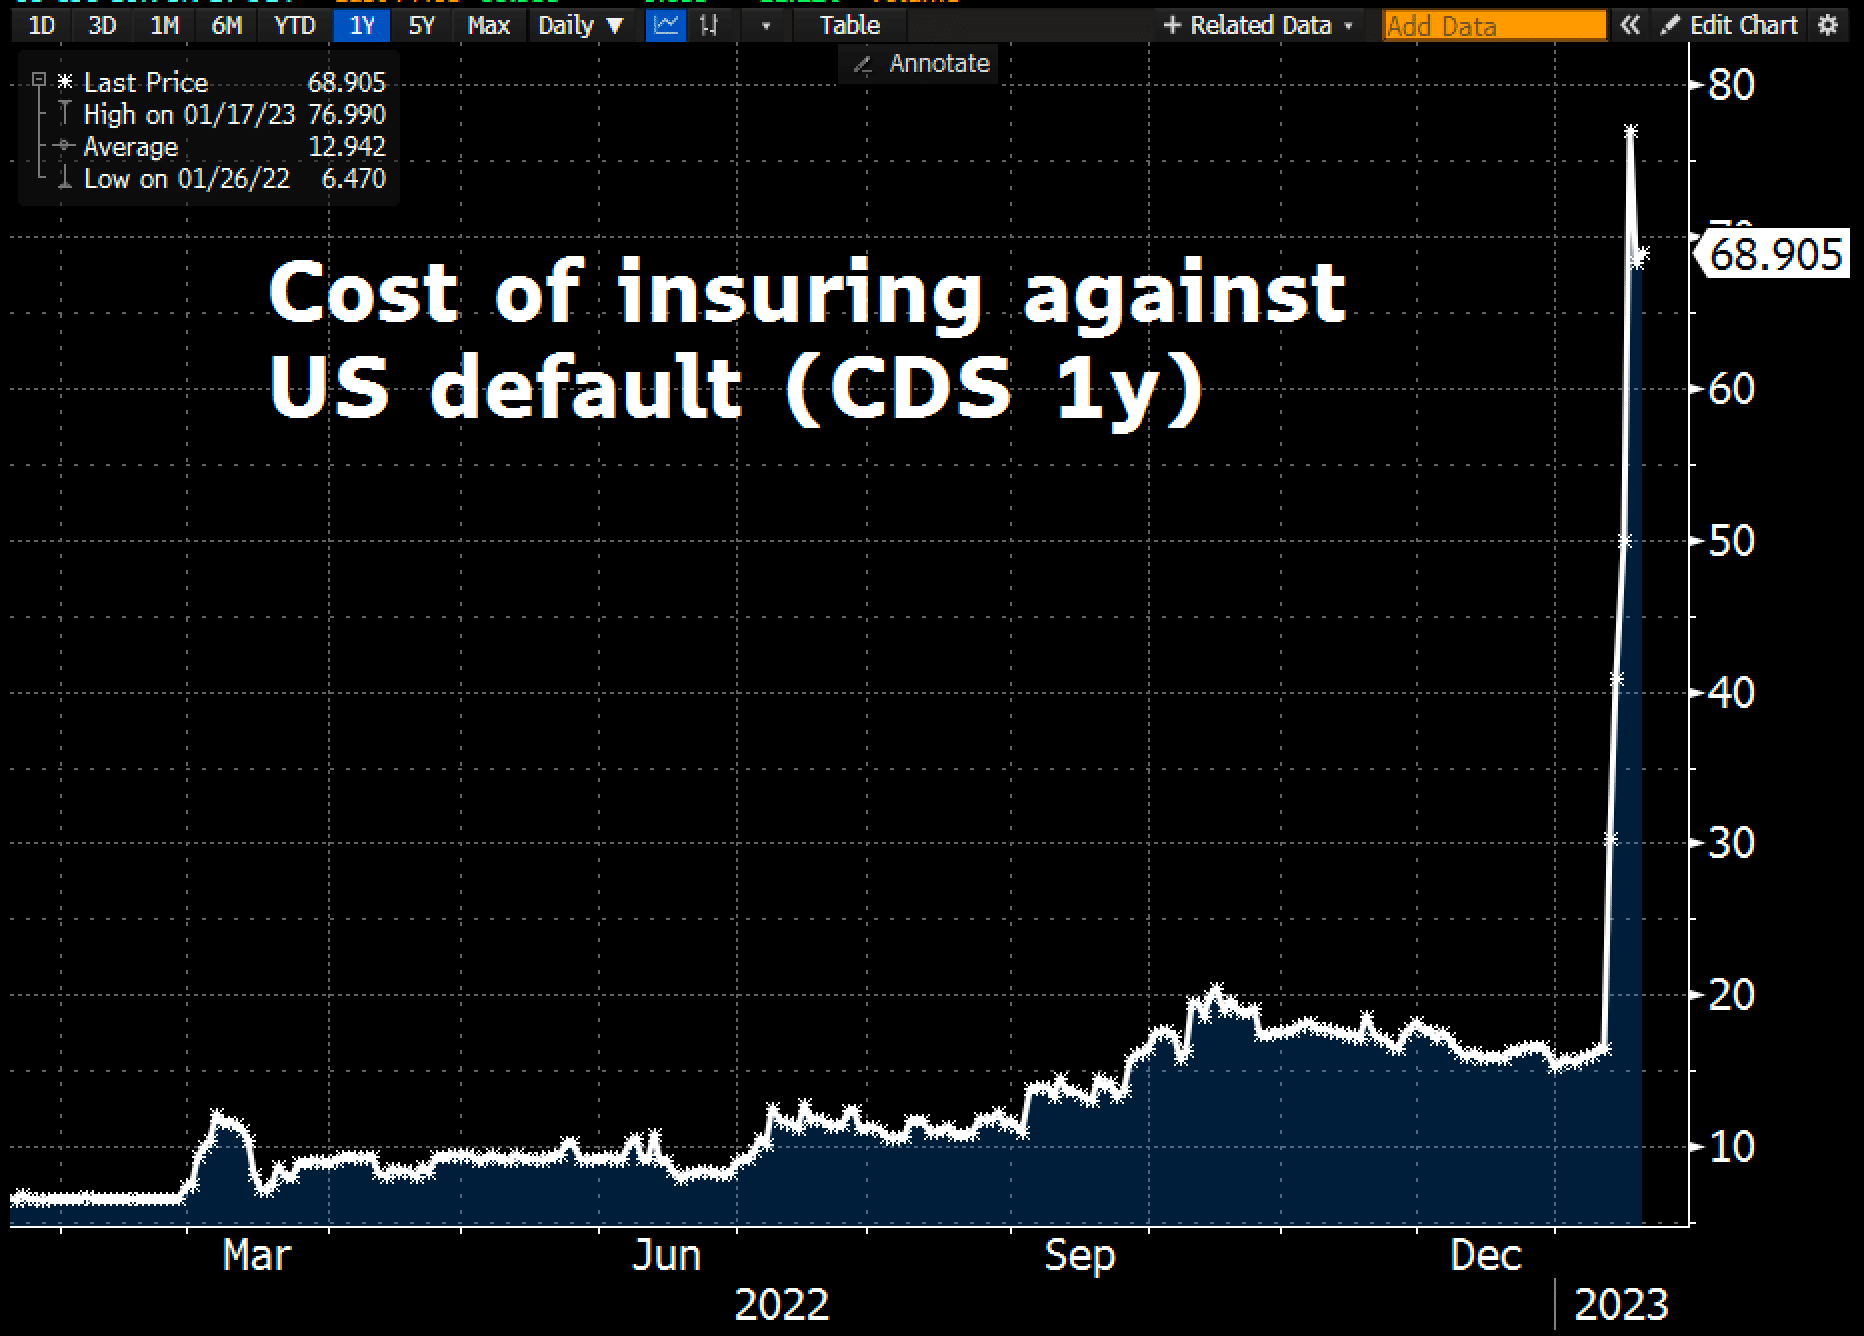
US credit rating as of January 19th, 2023. Source: Holger Zschäpitz
One-year insurance costs against a default (CDS) of the U.S. have jumped recently as the debt ceiling (currently 31.4 USD trillion) has been reached. Once again, Democrats and Republicans are engaged in an absurd but bitter dispute. The last time the credit rating of the United States was downgraded from AAA to AA+ was on August 5th, 2011. In the summer of 2011, the price of gold strongly priced in this move in advance, rising from 1,470 USD to 1,920 USD.
(Click on image to enlarge)
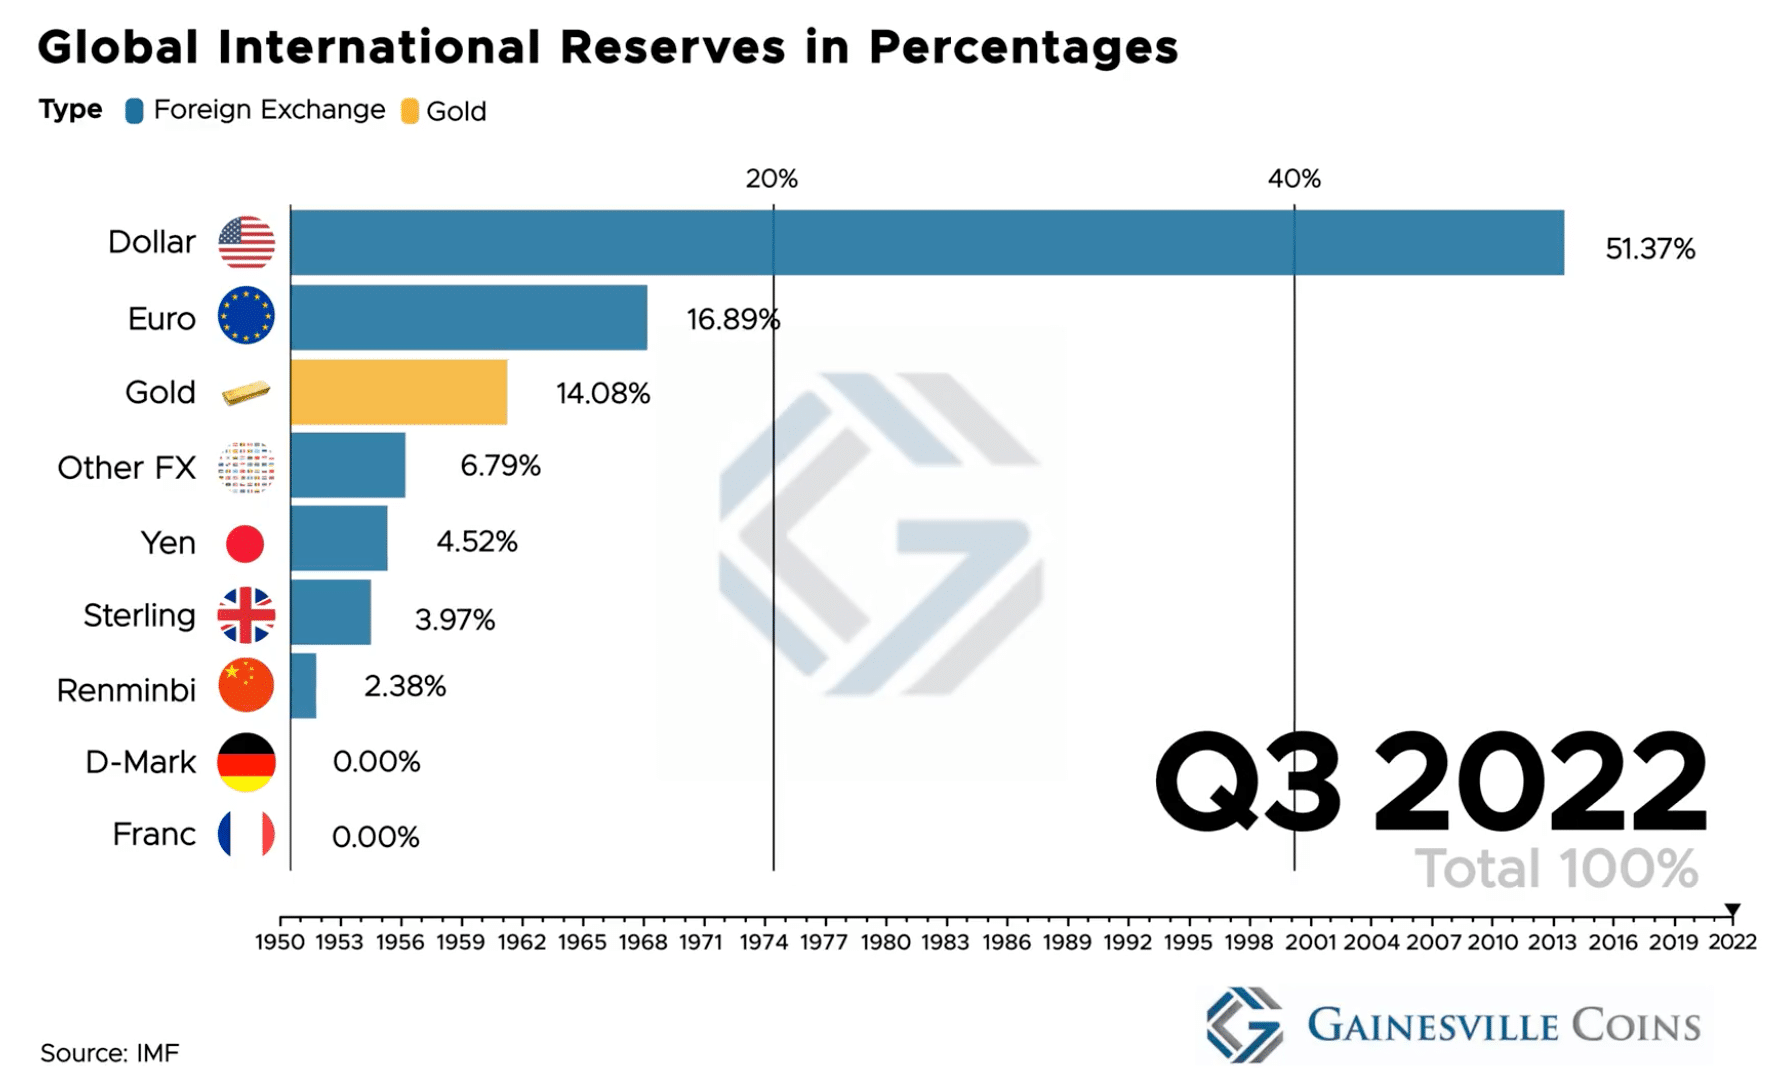
Global international reserves in percentages as of Jan. 24, 2023. Source: Gainesville Coins
With the proxy war in Ukraine, as well as increasingly close relations between Saudi Arabia, Russia and China, and the theoretical threat of a U.S. default, the dominance of the U.S. petrodollar is increasingly being challenged. Especially since Saudi Arabia announced to trade oil in other currencies in the future. At the same time, the U.S. credit rating is declining due to the dispute over the debt ceiling.
The main beneficiary of the dwindling confidence in paper currencies is likely to be the gold price. By historical standards, central banks and institutional investors in particular hold only a small percentage of their reserves in gold. And ultimately, the BRICS countries will also settle their trade balances in gold, as there is certainly no mutual trust here and the Renminbi is far from being a reserve currency.
Therefore, from a fundamental perspective, everything points to a significant increase in demand for gold in the coming years.
Conclusion: Gold – Rally is losing momentum
Gold posted an impressive rally over the last three months and still has a good chance to deliver the typical final exaggeration until spring in the coming weeks. Price targets between 1,950 USD and 2,075 USD are therefore still quite realistic.
At the same time, the overbought situation and the fading momentum call for caution. Speculative positions now no longer provide a good risk/reward-ratio. Physical precious metals, on the other hand, are more important than ever and should account for at least 10% of total assets. Presumably, one will be able to add between March and July at more favorable prices.
More By This Author:
Bitcoin – Significant Recovery Expected
Gold – Fight Around The 200-Day Moving Average Not Yet Decided
Bitcoin - Some Chance For A Recovery
Disclaimer: All published information represents the opinion and analysis of Mr Florian Grummes & his partners, based on data available to him, at the time of writing. Mr. Grummes’s ...
more

