
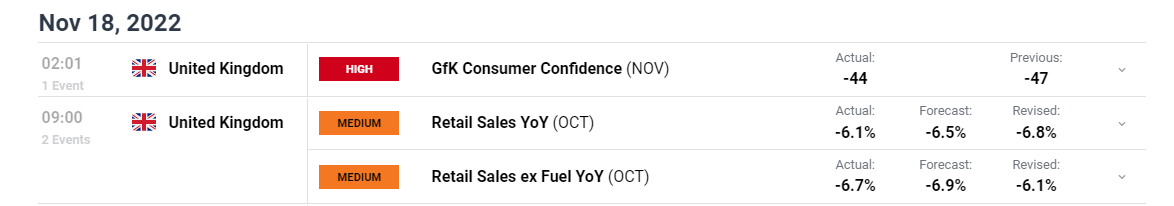
Upbeat Retails Sales (MOM) Overshadowed By Declines In Volumes Purchased
UK retail sales improved in October by 0.6% when compared to September. That statistic alone seems rather positive but year-on-year volumes decreased by a sizeable 6.1% compared to October 2021.
Customize and filter live economic data via our DaliyFX economic calendar
The ONS UK retail sales report showed food to be the major laggard for the October report, with volumes falling 0.4%. Positive readings via non-food stores, non-store retailing, and food more than made up for it, however.
The major issue facing UK consumers this year into next is a reduction in real household income, something that the Office for Budget Responsibility (OBR) forecasts will drop by 7% over the next 2 years - effectively placing households back to 2013 levels.
The chart below underscores the overarching retail trend of declining sales volumes ever since the peak in the spring of 2021, suggesting the holiday season is likely to be a more reserved one.
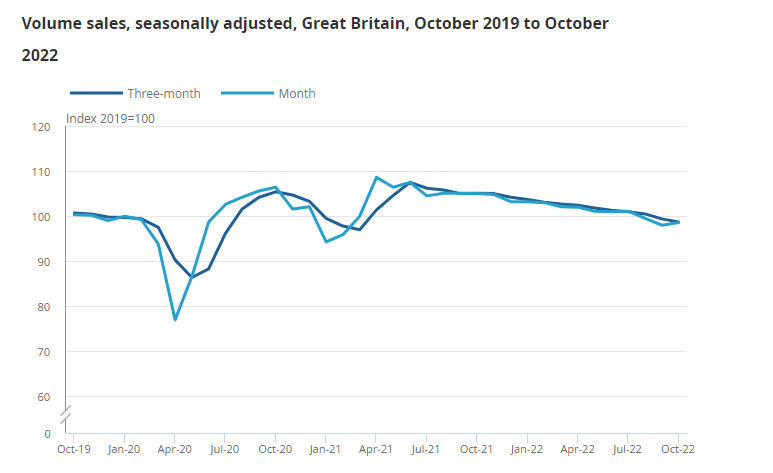
Source: ONS (Office for National Statistics)
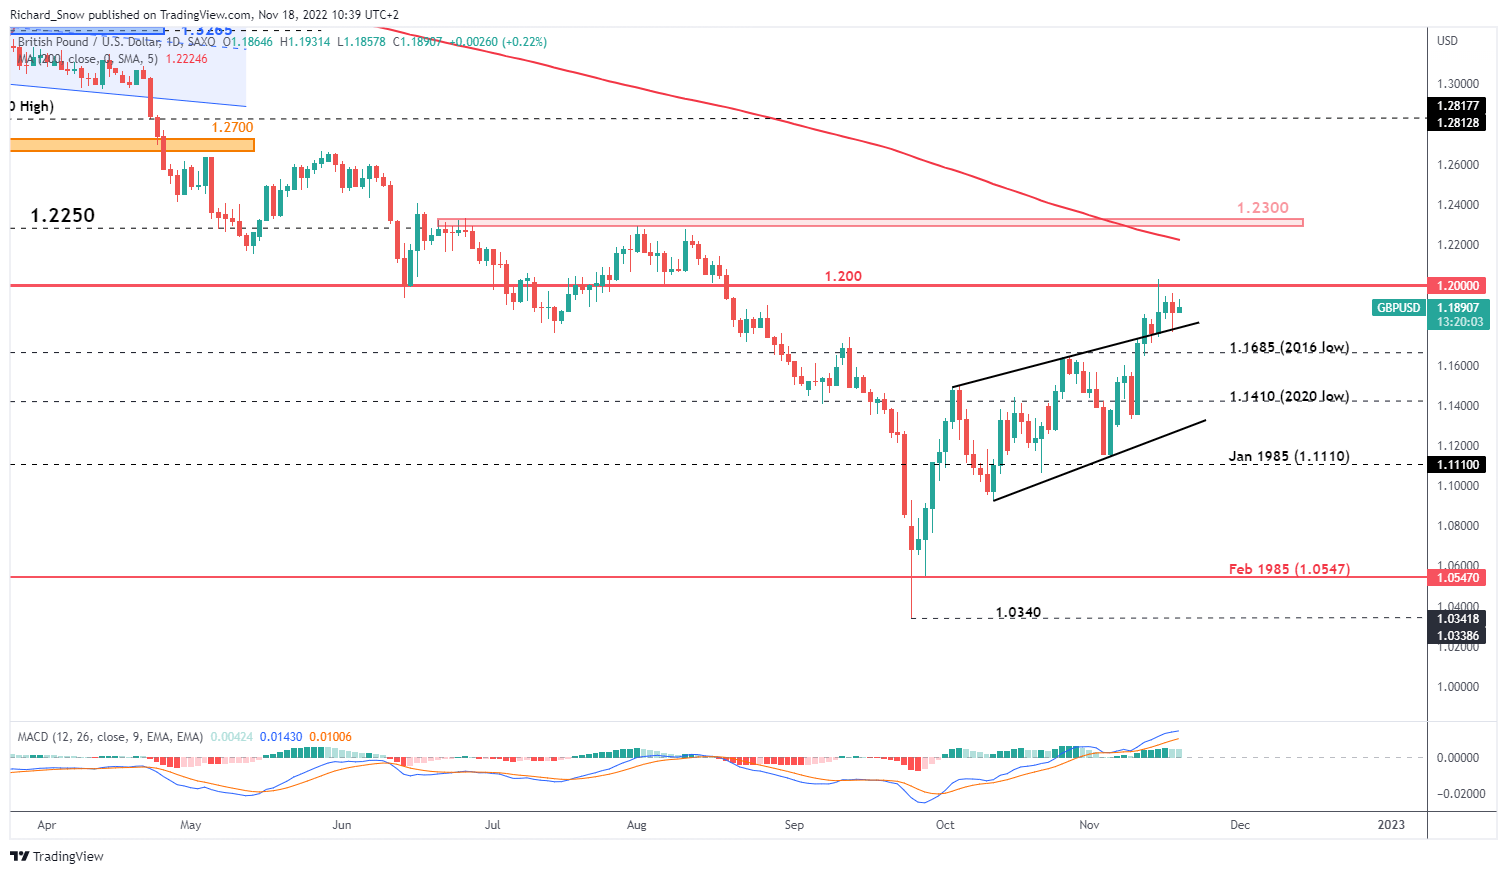
GBP/USD Technical Considerations
The daily chart reveals a period of consolidation ahead of that psychologically important 1.2000 level, with what appears to be a bullish pennant forming. The pennant is usually viewed as a bullish signal, suggesting that a hold above 1.2000 could mean further joy for the pound against the dollar. In such an event, the true test of the potential bullish continuation would be a hold above 1.2000 after a retracement which could see the next zone of resistance 1.2300 come into focus.
Trendline support (prior trendline resistance) underpins cable, followed by the 2016 low of 1.1685 and 1.1410.
GBP/USD Daily Chart
(Click on image to enlarge)
Source: TradingView, prepared by Richard Snow
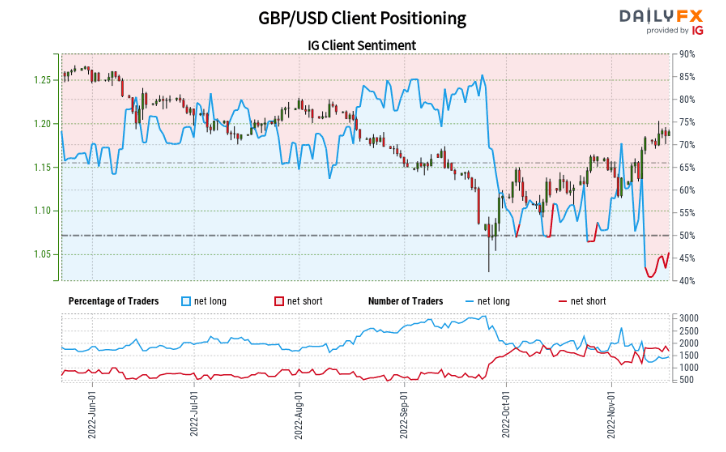
GBP/USD: Retail trader data shows 43.59% of traders are net-long with the ratio of traders short to long at 1.29 to 1.
We typically take a contrarian view to crowd sentiment, and the fact traders are net-short suggests GBP/USD prices may continue to rise.
The number of traders net-long is 4.15% lower than yesterday and 2.22% lower than last week, while the number of traders net-short is 3.81% lower than yesterday and 2.32% lower than last week.
Positioning is more net-short than yesterday but less net-short from last week. The combination of current sentiment and recent changes gives us a further mixed GBP/USD trading outlook.
The economic calendar is rather light next week, with US durable goods, Michigan consumer sentiment, and the FOMC minutes the only high-level scheduled risk events for the week.
More By This Author:
UK Fiscal Statement Urges Citizens To Tighten Belts, GBP Drops
Gold Remains Vulnerable Below $1800 Key Level And 200-Day MA
GBP Breaking News: Energy Sources Sustain Extreme UK Inflation, Highest Since 1981


Comments
Log in or sign up to join the conversation.