
The UK’s Chancellor announced his priorities lie with stability, growth, and public services as the government plan to raise taxes and cut government spending. Despite over £100 billion to cushion high energy prices the outlook of the UK economy remains dire as the OBR sees the UK already in a recession with real household incomes dropping 7% over the next two years – taking incomes down to 2013 levels. Markets brace for a tough time ahead, especially when the BoE is anticipated to hike interest rates in mid-December by 50 basis points.
Below is a summary of the main aspects of the UK fiscal statement:
Tax Changes
- Reduction of the threshold of the 45p rate of income tax to £125,140 from £150,000
- Tax thresholds will remain for another 2 years
- Stamp duty reductions will be abolished in March 2025
Energy
- Oil and gas firms’ profits are taxed at 35%, up from 25% which should be temporary, not to deter investment
- The temporary levy on electricity generators will be 45%
- Hunt targets to reduce energy usage in buildings by 15% announcing a further £6 billion in funding
- Government confirms the state-backed nuclear plant will be going ahead to help achieve energy independence
Government spending
- Public service real spending increases will be limited to 1% from 2025 to 2028 – prior plans targeted 3.7%
- Debt as a percentage of GDP, according to the Chancellor and OBR, will nudge down from 97.6% in 2025/26 to 97.3% in 2027/28
Social Services & Pensions
- Pensions triple lock will be honored. In April, pensions will increase in line with inflation
- Benefits to go up in line with inflation in April 10.1%
- Social rent increases capped at 7%
- National living wage to increase to £10.42
Prudent Fiscal Plan Signals Tough Times Ahead For UK Citizens
The UK government has its work cut out for them and recent political missteps of the brief Truss administration certainly didn’t help matters. The fiscal adventurism proposed by Truss and her Chancellor Kwasi Kwarteng in September - which amounted to unlimited borrowing that would be used to fund mass government spending - resulted in a ‘run’ on Sterling assets that was so severe, it required the Bank of England to step in to stabilize financial markets.
UK assets have recovered rather well from the September lows which are particularly apparent in the FTSE 100 Index and the pound sterling.
FTSE 100 Analyzed Ahead Of The UK Fiscal Statement
The FTSE 100 has been on an impressive uptrend since the September low coinciding with the aftermath of the UK mini-budget and subsequent pension fund debacle. The bullish price action is however showing signs of fatigue with a series of extended upper wicks as prices made successive lower highs in the previous 3 sessions.
An additional hint of a potential pullback appears via the proximity of the 200-day simple moving average (SMA) which acts as immediate resistance heading into the announcement. Equity market participants will be keeping an eye on government spending and the energy subsidy if the index is to move higher, as real household incomes have come under great pressure due to rapidly rising prices. Just yesterday the UK confirmed an 11.1% increase in CPI inflation for October, compared to the same time last year.
FTSE 100 Daily Chart
(Click on image to enlarge)
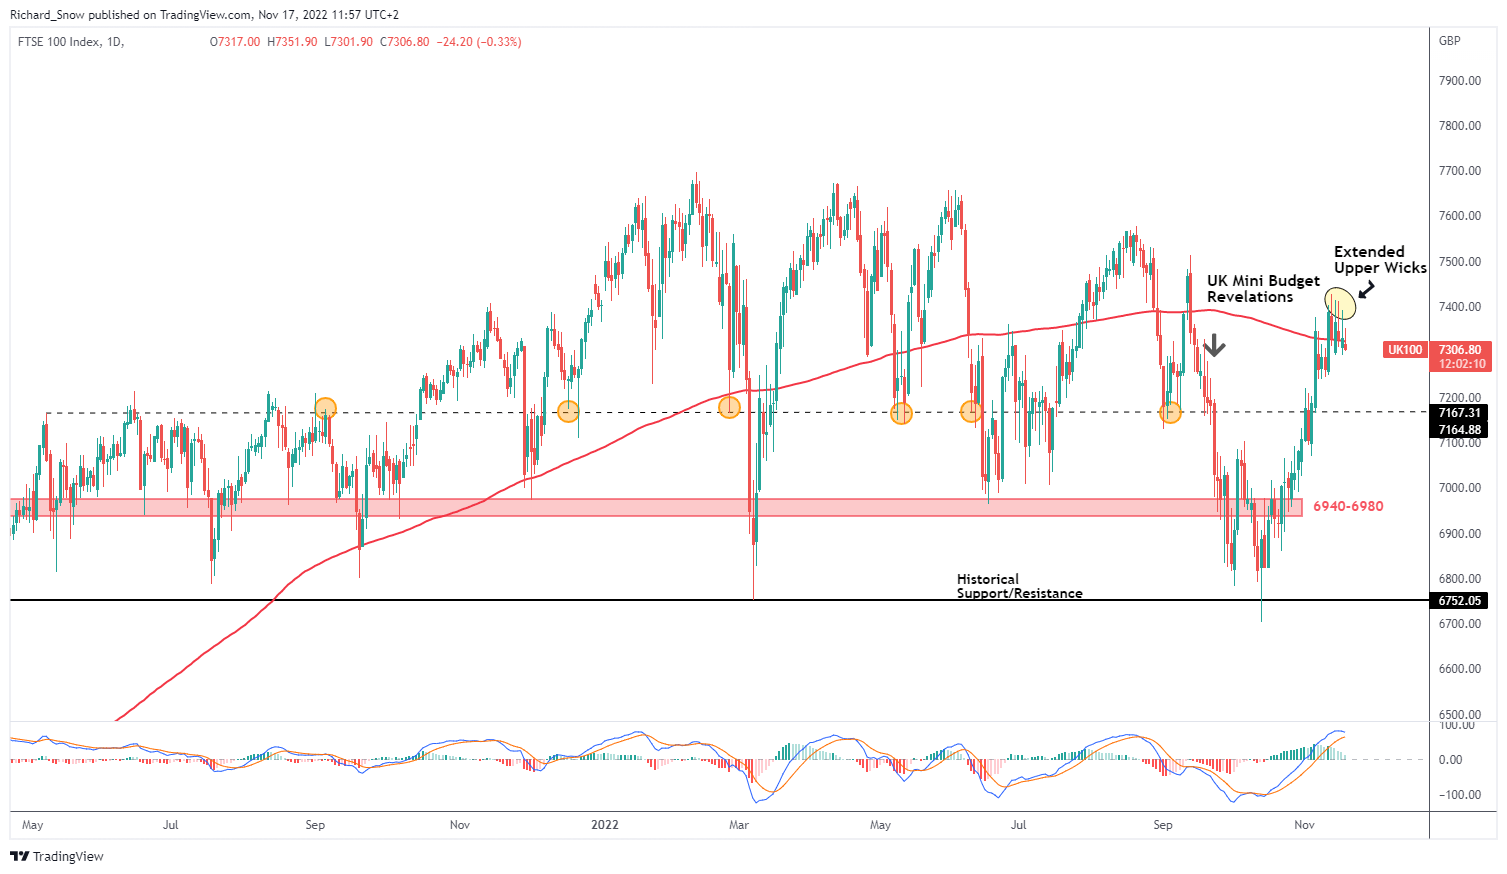
Source: TradingView, prepared by Richard Snow
The 4-hour chart reveals more granular price movements that suggest we may see prices move lower in the near term. The descending triangle shown below is usually a continuation pattern but has also appeared as a topping formation. Ahead of the announcement, price action dropped towards support which is to be closely monitored for any bearish follow-through.
With a 14-day ATR reading of 112, volatility is still elevated. Support lies at the horizontal level of triangle 7295. The next zone of support appears at the 7240-7245 handle. Looking at a possible measured move (resulting from a successful breakdown of the descending triangle) sees 7160 as the level of consideration.
FTSE 100 4-Hour Chart
(Click on image to enlarge)
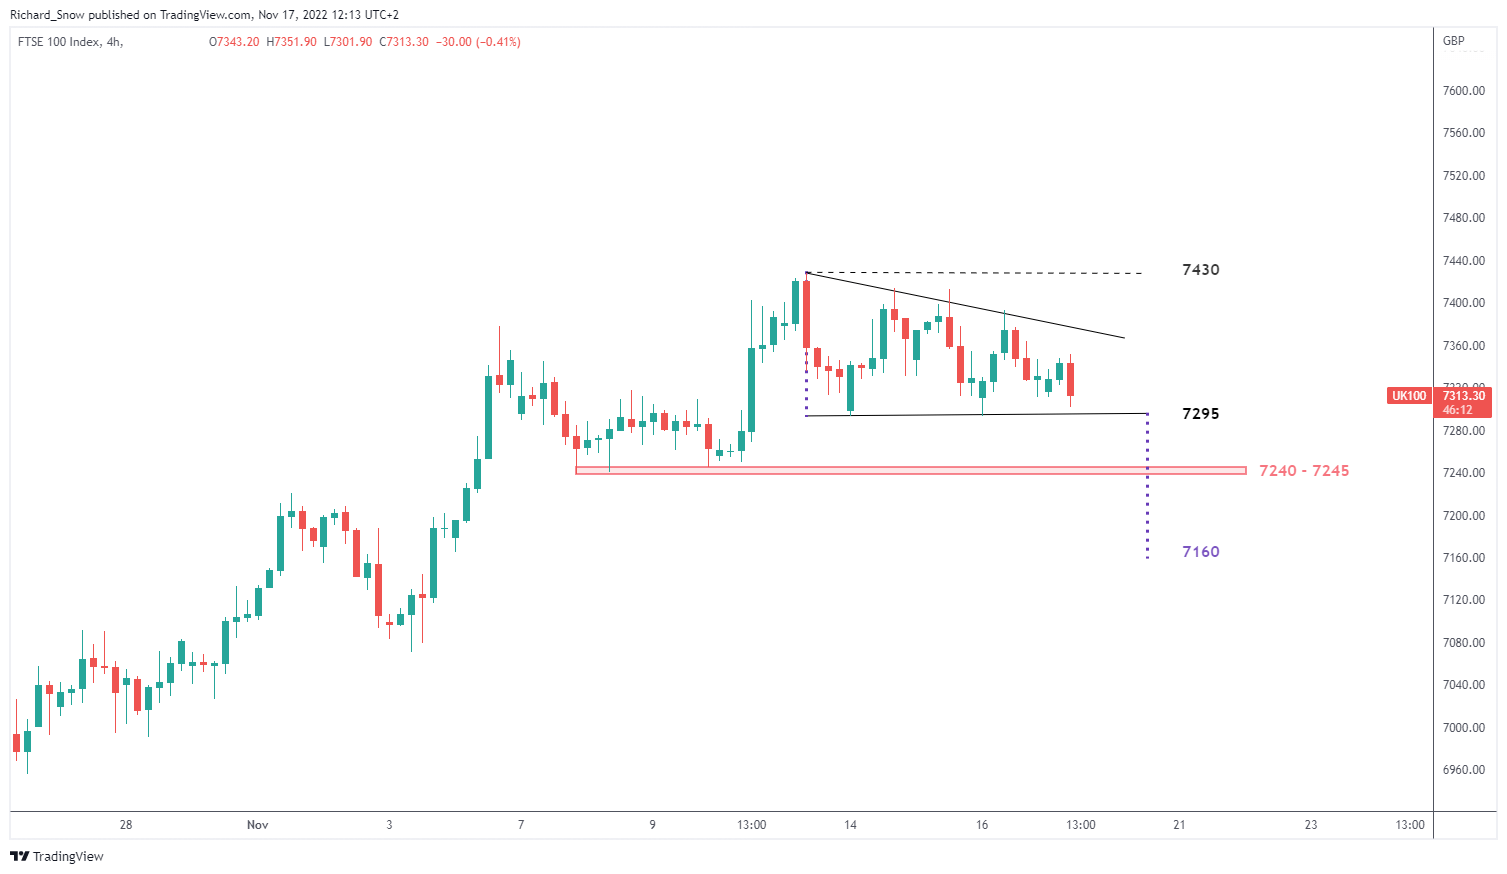
Source: TradingView, prepared by Richard Snow
Pound Sterling Response
GBP/USD dropped ahead of the announcement and continued that trend during the address, at least on a short-term basis.
GBP/USD 5-Minute Chart
(Click on image to enlarge)
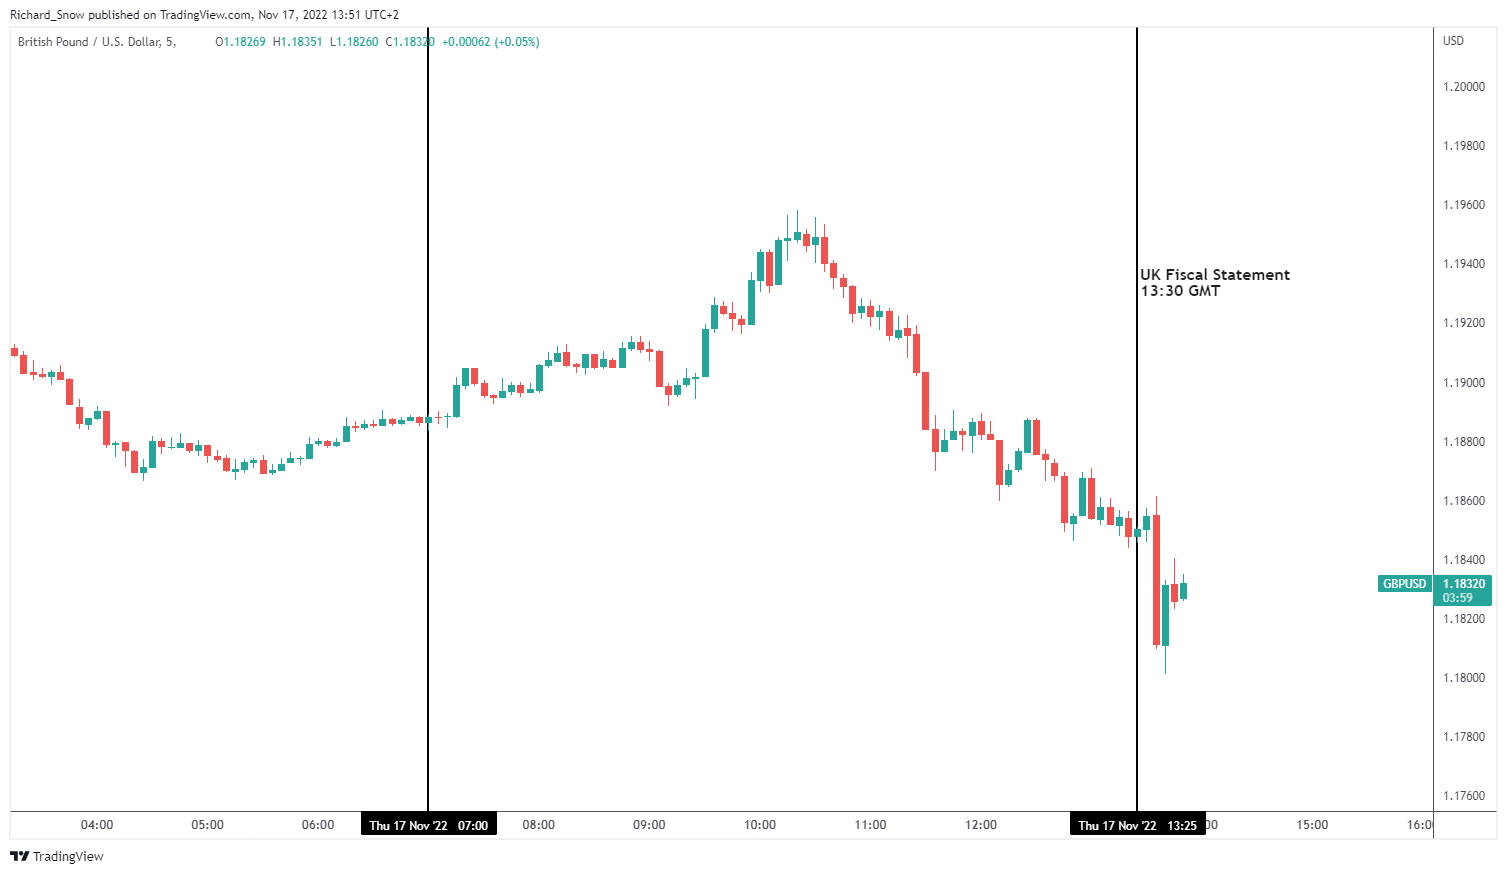
Source: TradingView, prepared by Richard Snow
More By This Author:
Gold Remains Vulnerable Below $1800 Key Level And 200-Day MAGBP Breaking News: Energy Sources Sustain Extreme UK Inflation, Highest Since 1981
EUR/USD Latest: EURUSD Resilient Ahead Of Inflation Print, NATO Meeting


Comments
Log in or sign up to join the conversation.